QUICK STATISTICS
UTMC / Members and Distributors Statistics
Registered UTC, UTMC / Members, IUTA & CUTA (2026)
| As at month end of | No. of | |||
|---|---|---|---|---|
| UTC | UTMC / Members | IUTA | CUTA | |
| January 2026 | 54,306 | 42 | 56 | 25 |
| February 2026 | 54,996 | 42 | 56 | 25 |
| March 2026 | 55,718 | 42 | 56 | 25 |
| April 2026 | 56,245 | 42 | 56 | 25 |
| May 2026 | 57,040 | 42 | 55 | 26 |
| June 2026 | 57,589 | 42 | 55 | 26 |
| July 2026 | ||||
| August 2026 | ||||
| September 2026 | ||||
| October 2026 | ||||
| November 2026 | ||||
| December 2026 | ||||
Registered UTC, UTMC / Members, IUTA & CUTA (2025)
| As at month end of | No. of | |||
|---|---|---|---|---|
| UTC | UTMC / Members | IUTA | CUTA | |
| January 2025 | 58,073 | 42 | 53 | 25 |
| February 2025 | 58,569 | 42 | 53 | 25 |
| March 2025 | 59,683 | 42 | 53 | 26 |
| April 2025 | 59,909 | 42 | 53 | 26 |
| May 2025 | 59,933 | 42 | 53 | 26 |
| June 2025 | 59,551 | 42 | 53 | 26 |
| July 2025 | 59,919 | 42 | 54 | 26 |
| August 2025 | 60,379 | 42 | 54 | 26 |
| September 2025 | 60,757 | 42 | 54 | 26 |
| October 2025 | 61,226 | 42 | 55 | 26 |
| November 2025 | 61,729 | 42 | 55 | 26 |
| December 2025 | 53,919 | 42 | 56 | 25 |
Registered UTC, UTMC / Members, IUTA & CUTA (2024)
| As at month end of | No. of | |||
|---|---|---|---|---|
| UTC | UTMC / Members | IUTA | CUTA | |
| Jan-24 | 56,792 | 40 | 51 | 21 |
| Feb-24 | 57,278 | 40 | 51 | 21 |
| Mar-24 | 57,805 | 41 | 52 | 22 |
| Apr-24 | 58,164 | 41 | 52 | 22 |
| May-24 | 58,671 | 42 | 52 | 23 |
| Jun-24 | 59,283 | 42 | 53 | 23 |
| Jul-24 | 59,921 | 42 | 53 | 23 |
| Aug-24 | 60,761 | 42 | 53 | 24 |
| Sep-24 | 61,606 | 42 | 53 | 25 |
| Oct-24 | 62,340 | 42 | 53 | 25 |
| Nov-24 | 62,902 | 42 | 53 | 25 |
| Dec-24 | 57,750 | 42 | 53 | 25 |
Registered UTC, UTMC / Members, IUTA & CUTA (2023)
| As at month end of | No. of | |||
|---|---|---|---|---|
| UTC | UTMC / Members | IUTA | CUTA | |
| Jan-23 | 59,224 | 40 | 51 | 20 |
| Feb-23 | 59,640 | 40 | 51 | 20 |
| Mar-23 | 60,163 | 40 | 51 | 20 |
| Apr-23 | 60,285 | 40 | 51 | 20 |
| May-23 | 60,664 | 40 | 51 | 21 |
| Jun-23 | 61,018 | 40 | 51 | 21 |
| Jul-23 | 61,316 | 40 | 51 | 21 |
| Aug-23 | 61,799 | 40 | 51 | 21 |
| Sep-23 | 62,162 | 40 | 51 | 21 |
| Oct-23 | 62,487 | 40 | 51 | 21 |
| Nov-23 | 62,869 | 40 | 51 | 21 |
| Dec-23 | 56,443 | 40 | 51 | 21 |
Registered UTC, UTMC / Members, IUTA & CUTA (2022)
| As at month end of | No. of | |||
|---|---|---|---|---|
| UTC | UTMC / Members | IUTA | CUTA | |
| Jan-22 | 60,772 | 40 | 53 | 20 |
| Feb-22 | 61,553 | 40 | 53 | 20 |
| Mar-22 | 62,508 | 40 | 53 | 20 |
| Apr-22 | 62,970 | 40 | 53 | 20 |
| May-22 | 63,565 | 40 | 53 | 20 |
| Jun-22 | 64,043 | 40 | 53 | 20 |
| Jul-22 | 64,551 | 40 | 53 | 20 |
| Aug-22 | 65,089 | 40 | 52 | 20 |
| Sep-22 | 65,522 | 40 | 52 | 20 |
| Oct-22 | 65,832 | 40 | 52 | 20 |
| Nov-22 | 66,207 | 40 | 51 | 20 |
| Dec-22 | 58,959 | 40 | 51 | 20 |
Registered UTC, UTMC / Members, IUTA & CUTA (2021)
| As at month end of | No. of | |||
|---|---|---|---|---|
| UTC | UTMC / Members | IUTA | CUTA | |
| Jan-21 | 55,274 | 40 | 54 | 18 |
| Feb-21 | 55,543 | 40 | 54 | 18 |
| Mar-21 | 57,267 | 40 | 54 | 18 |
| Apr-21 | 58,978 | 40 | 54 | 18 |
| May-21 | 59,475 | 40 | 54 | 18 |
| Jun-21 | 59,975 | 40 | 54 | 18 |
| Jul-21 | 60,572 | 40 | 54 | 18 |
| Aug-21 | 61,550 | 40 | 53 | 18 |
| Sep-21 | 63,200 | 40 | 53 | 19 |
| Oct-21 | 63,833 | 40 | 53 | 20 |
| Nov-21 | 64,713 | 40 | 53 | 20 |
| Dec-21 | 60,138 | 40 | 53 | 20 |
Registered UTC, UTMC / Members, IUTA & CUTA (2020)
| As at month end of | No. of | |||
|---|---|---|---|---|
| UTC | UTMC / Members | IUTA | CUTA | |
| Jan-20 | 58,582 | 39 | 54 | 17 |
| Feb-20 | 59,347 | 39 | 54 | 18 |
| Mar-20 | 59,786 | 39 | 54 | 18 |
| Apr-20 | 59,552 | 39 | 54 | 18 |
| May-20 | 59,621 | 39 | 54 | 18 |
| Jun-20 | 59,613 | 39 | 54 | 17 |
| Jul-20 | 60,106 | 39 | 54 | 18 |
| Aug-20 | 60,821 | 39 | 54 | 18 |
| Sep-20 | 61,823 | 39 | 54 | 18 |
| Oct-20 | 62,592 | 39 | 54 | 18 |
| Nov-20 | 62,756 | 40 | 54 | 18 |
| Dec-20 | 55,179 | 40 | 54 | 18 |
Registered UTC, UTMC / Members, IUTA & CUTA (2019)
| As at month end of | No. of | |||
|---|---|---|---|---|
| UTC | UTMC / Members | IUTA | CUTA | |
| Jan-19 | 60,459 | 37 | 51 | 17 |
| Feb-19 | 60,430 | 39 | 51 | 17 |
| Mar-19 | 62,848 | 40 | 51 | 17 |
| Apr-19 | 63,466 | 40 | 52 | 17 |
| May-19 | 64,704 | 40 | 52 | 17 |
| Jun-19 | 65,347 | 40 | 52 | 17 |
| Jul-19 | 65,870 | 40 | 52 | 17 |
| Aug-19 | 66,760 | 40 | 52 | 17 |
| Sep-19 | 67,841 | 40 | 52 | 17 |
| Oct-19 | 68,478 | 40 | 53 | 16 |
| Nov-19 | 69,254 | 40 | 54 | 17 |
| Dec-19 | 58,068 | 39 | 54 | 17 |
Registered UTC, UTMC / Members, IUTA & CUTA (2018)
| As at month end of | No. of | |||
|---|---|---|---|---|
| UTC | UTMC / Members | IUTA | CUTA | |
| Jan-18 | 58,360 | 36 | 49 | 15 |
| Feb-18 | 59,572 | 36 | 49 | 16 |
| Mar-18 | 61,080 | 36 | 49 | 16 |
| Apr-18 | 62,371 | 36 | 49 | 16 |
| May-18 | 63,288 | 36 | 49 | 16 |
| Jun-18 | 64,406 | 36 | 49 | 17 |
| Jul-18 | 65,269 | 36 | 49 | 17 |
| Aug-18 | 66,425 | 37 | 50 | 17 |
| Sep-18 | 67,455 | 37 | 50 | 17 |
| Oct-18 | 68,511 | 37 | 50 | 17 |
| Nov-18 | 69,437 | 37 | 50 | 17 |
| Dec-18 | 59,565 | 37 | 50 | 17 |
Registered UTC, UTMC / Members, IUTA & CUTA (2017)
| As at month end of | No. of | |||
|---|---|---|---|---|
| UTC | UTMC / Members | IUTA | CUTA | |
| Jan-17 | 55,026 | 36 | 48 | 10 |
| Feb-17 | 56,097 | 36 | 47 | 10 |
| Mar-17 | 56,926 | 36 | 47 | 11 |
| Apr-17 | 58,314 | 36 | 47 | 11 |
| May-17 | 59,527 | 36 | 47 | 11 |
| Jun-17 | 60,538 | 36 | 46 | 12 |
| Jul-17 | 60,432 | 36 | 46 | 13 |
| Aug-17 | 61,663 | 36 | 46 | 13 |
| Sep-17 | 62,605 | 36 | 47 | 14 |
| Oct-17 | 63,840 | 36 | 47 | 14 |
| Nov-17 | 64,943 | 36 | 49 | 14 |
| Dec-17 | 57,296 | 36 | 49 | 15 |
Registered PRC, PRP, IPRA, CPRA (2026)
| As at month end of | No. of | |||
|---|---|---|---|---|
| PRC | PRP | IPRA | CPRA | |
| January 2026 | 29,887 | 9 | 13 | 23 |
| February 2026 | 30,282 | 9 | 13 | 23 |
| March 2026 | 30,746 | 9 | 13 | 23 |
| April 2026 | 31,187 | 9 | 13 | 23 |
| May 2026 | 31,622 | 9 | 13 | 24 |
| June 2026 | 32,205 | 9 | 13 | 24 |
| July 2026 | ||||
| August 2026 | ||||
| September 2026 | ||||
| October 2026 | ||||
| November 2026 | ||||
| December 2026 | ||||
Registered PRC, PRP, IPRA, CPRA (2025)
| As at month end of | No. of | |||
|---|---|---|---|---|
| PRC | PRP | IPRA | CPRA | |
| January 2025 | 28,104 | 9 | 12 | 23 |
| February 2025 | 28,115 | 9 | 12 | 23 |
| March 2025 | 28,432 | 9 | 12 | 24 |
| April 2025 | 28,519 | 9 | 12 | 24 |
| May 2025 | 28,525 | 9 | 12 | 24 |
| June 2025 | 28,342 | 9 | 12 | 24 |
| July 2025 | 28,528 | 9 | 12 | 24 |
| August 2025 | 28,818 | 9 | 12 | 24 |
| September 2025 | 29,203 | 9 | 12 | 24 |
| October 2025 | 29,888 | 9 | 12 | 24 |
| November 2025 | 30,601 | 9 | 12 | 24 |
| December 2025 | 29,411 | 9 | 13 | 23 |
Registered PRC, PRP, IPRA, CPRA (2024)
| As at month end of | No. of | |||
|---|---|---|---|---|
| PRC | PRP | IPRA | CPRA | |
| Jan-24 | 28,007 | 9 | 12 | 19 |
| Feb-24 | 28,044 | 9 | 12 | 20 |
| Mar-24 | 28,117 | 9 | 12 | 21 |
| Apr-24 | 28,164 | 9 | 12 | 22 |
| May-24 | 28,172 | 9 | 12 | 23 |
| Jun-24 | 28,291 | 9 | 12 | 23 |
| Jul-24 | 28,491 | 9 | 12 | 23 |
| Aug-24 | 28,728 | 9 | 12 | 23 |
| Sep-24 | 28,947 | 9 | 12 | 23 |
| Oct-24 | 29,263 | 9 | 12 | 23 |
| Nov-24 | 29,339 | 9 | 12 | 23 |
| Dec-24 | 28,073 | 9 | 12 | 23 |
Registered PRC, PRP, IPRA, CPRA (2023)
| As at month end of | No. of | |||
|---|---|---|---|---|
| PRC | PRP | IPRA | CPRA | |
| Jan-23 | 28,142 | 9 | 12 | 19 |
| Feb-23 | 28,112 | 9 | 12 | 19 |
| Mar-23 | 28,204 | 9 | 12 | 19 |
| Apr-23 | 28,181 | 9 | 12 | 19 |
| May-23 | 28,245 | 9 | 12 | 19 |
| Jun-23 | 28,337 | 9 | 12 | 19 |
| Jul-23 | 28,389 | 9 | 12 | 19 |
| Aug-23 | 28,519 | 9 | 12 | 19 |
| Sep-23 | 28,709 | 9 | 12 | 19 |
| Oct-23 | 28,872 | 9 | 12 | 19 |
| Nov-23 | 29,261 | 9 | 12 | 19 |
| Dec-23 | 27,943 | 9 | 12 | 19 |
Registered PRC, PRP, IPRA, CPRA (2022)
| As at month end of | No. of | |||
|---|---|---|---|---|
| PRC | PRP | IPRA | CPRA | |
| Jan-22 | 27,564 | 8 | 12 | 19 |
| Feb-22 | 27,744 | 8 | 12 | 19 |
| Mar-22 | 27,977 | 8 | 12 | 19 |
| Apr-22 | 28,111 | 8 | 12 | 19 |
| May-22 | 28,291 | 8 | 13 | 19 |
| Jun-22 | 28,491 | 8 | 13 | 19 |
| Jul-22 | 28,735 | 8 | 13 | 19 |
| Aug-22 | 29,174 | 8 | 13 | 19 |
| Sep-22 | 29,268 | 8 | 13 | 19 |
| Oct-22 | 29,235 | 8 | 13 | 19 |
| Nov-22 | 29,334 | 8 | 12 | 19 |
| Dec-22 | 28,106 | 9 | 12 | 19 |
Registered PRC, PRP, IPRA, CPRA (2021)
| As at month end of | No. of | |||
|---|---|---|---|---|
| PRC | PRP | IPRA | CPRA | |
| Jan-21 | 24,917 | 8 | 13 | 18 |
| Feb-21 | 24,919 | 8 | 13 | 18 |
| Mar-21 | 24,988 | 8 | 12 | 18 |
| Apr-21 | 25,185 | 8 | 12 | 18 |
| May-21 | 25,273 | 8 | 12 | 18 |
| Jun-21 | 25,341 | 8 | 12 | 18 |
| Jul-21 | 25,486 | 8 | 12 | 18 |
| Aug-21 | 25,801 | 8 | 12 | 18 |
| Sep-21 | 26,269 | 8 | 12 | 18 |
| Oct-21 | 26,781 | 8 | 12 | 19 |
| Nov-21 | 27,504 | 8 | 12 | 19 |
| Dec-21 | 27,436 | 8 | 12 | 19 |
Registered PRC, PRP, IPRA, CPRA (2020)
| As at month end of | No. of | |||
|---|---|---|---|---|
| PRC | PRP | IPRA | CPRA | |
| Jan-20 | 24,861 | 8 | 13 | 17 |
| Feb-20 | 24,963 | 8 | 13 | 18 |
| Mar-20 | 25,008 | 8 | 13 | 18 |
| Apr-20 | 24,890 | 8 | 13 | 18 |
| May-20 | 24,893 | 8 | 13 | 18 |
| Jun-20 | 24,894 | 8 | 13 | 17 |
| Jul-20 | 24,843 | 8 | 13 | 18 |
| Aug-20 | 24,973 | 8 | 13 | 18 |
| Sep-20 | 25,264 | 8 | 13 | 18 |
| Oct-20 | 25,508 | 8 | 13 | 18 |
| Nov-20 | 25,707 | 8 | 13 | 18 |
| Dec-20 | 24,916 | 8 | 13 | 18 |
Registered PRC, PRP, IPRA, CPRA (2019)
| As at month end of | No. of | |||
|---|---|---|---|---|
| PRC | PRP | IPRA | CPRA | |
| Jan-19 | 23,098 | 8 | 11 | 17 |
| Feb-19 | 23,698 | 8 | 11 | 17 |
| Mar-19 | 24,014 | 8 | 11 | 17 |
| Apr-19 | 24,000 | 8 | 11 | 17 |
| May-19 | 24,133 | 8 | 11 | 17 |
| Jun-19 | 24,226 | 8 | 11 | 17 |
| Jul-19 | 24,363 | 8 | 11 | 17 |
| Aug-19 | 24,642 | 8 | 11 | 17 |
| Sep-19 | 24,881 | 8 | 11 | 17 |
| Oct-19 | 25,155 | 8 | 11 | 16 |
| Nov-19 | 25,519 | 8 | 12 | 17 |
| Dec-19 | 24,728 | 8 | 12 | 17 |
Registered PRC, PRP, IPRA, CPRA (2018)
| As at month end of | No. of | |||
|---|---|---|---|---|
| PRC | PRP | IPRA | CPRA | |
| Jan-18 | 20,398 | 8 | 11 | 17 |
| Feb-18 | 20,479 | 8 | 11 | 17 |
| Mar-18 | 20,717 | 8 | 11 | 17 |
| Apr-18 | 20,398 | 8 | 11 | 17 |
| May-18 | 21,211 | 8 | 11 | 17 |
| Jun-18 | 21,308 | 8 | 11 | 17 |
| Jul-18 | 21,616 | 8 | 11 | 17 |
| Aug-18 | 22,291 | 8 | 11 | 17 |
| Sep-18 | 22,974 | 8 | 11 | 17 |
| Oct-18 | 23,657 | 8 | 11 | 17 |
| Nov-18 | 24,069 | 8 | 11 | 17 |
| Dec-18 | 22,946 | 8 | 11 | 17 |
Registered PRC, PRP, IPRA, CPRA (2017)
| As at month end of | No. of | |||
|---|---|---|---|---|
| PRC | PRP | IPRA | CPRA | |
| Jan-17 | 19,268 | 8 | 11 | 10 |
| Feb-17 | 19,383 | 8 | 11 | 10 |
| Mar-17 | 19,586 | 8 | 11 | 11 |
| Apr-17 | 19,799 | 8 | 11 | 11 |
| May-17 | 20,032 | 8 | 11 | 11 |
| Jun-17 | 20,161 | 8 | 11 | 12 |
| Jul-17 | 20,380 | 8 | 11 | 13 |
| Aug-17 | 20,784 | 8 | 11 | 13 |
| Sep-17 | 21,005 | 8 | 11 | 14 |
| Oct-17 | 21,181 | 8 | 11 | 14 |
| Nov-17 | 21,484 | 8 | 11 | 14 |
| Dec-17 | 20,646 | 8 | 11 | 15 |
Funds Statistics

Assets Under Management (AUM) of Funds Managed by FIMM Members
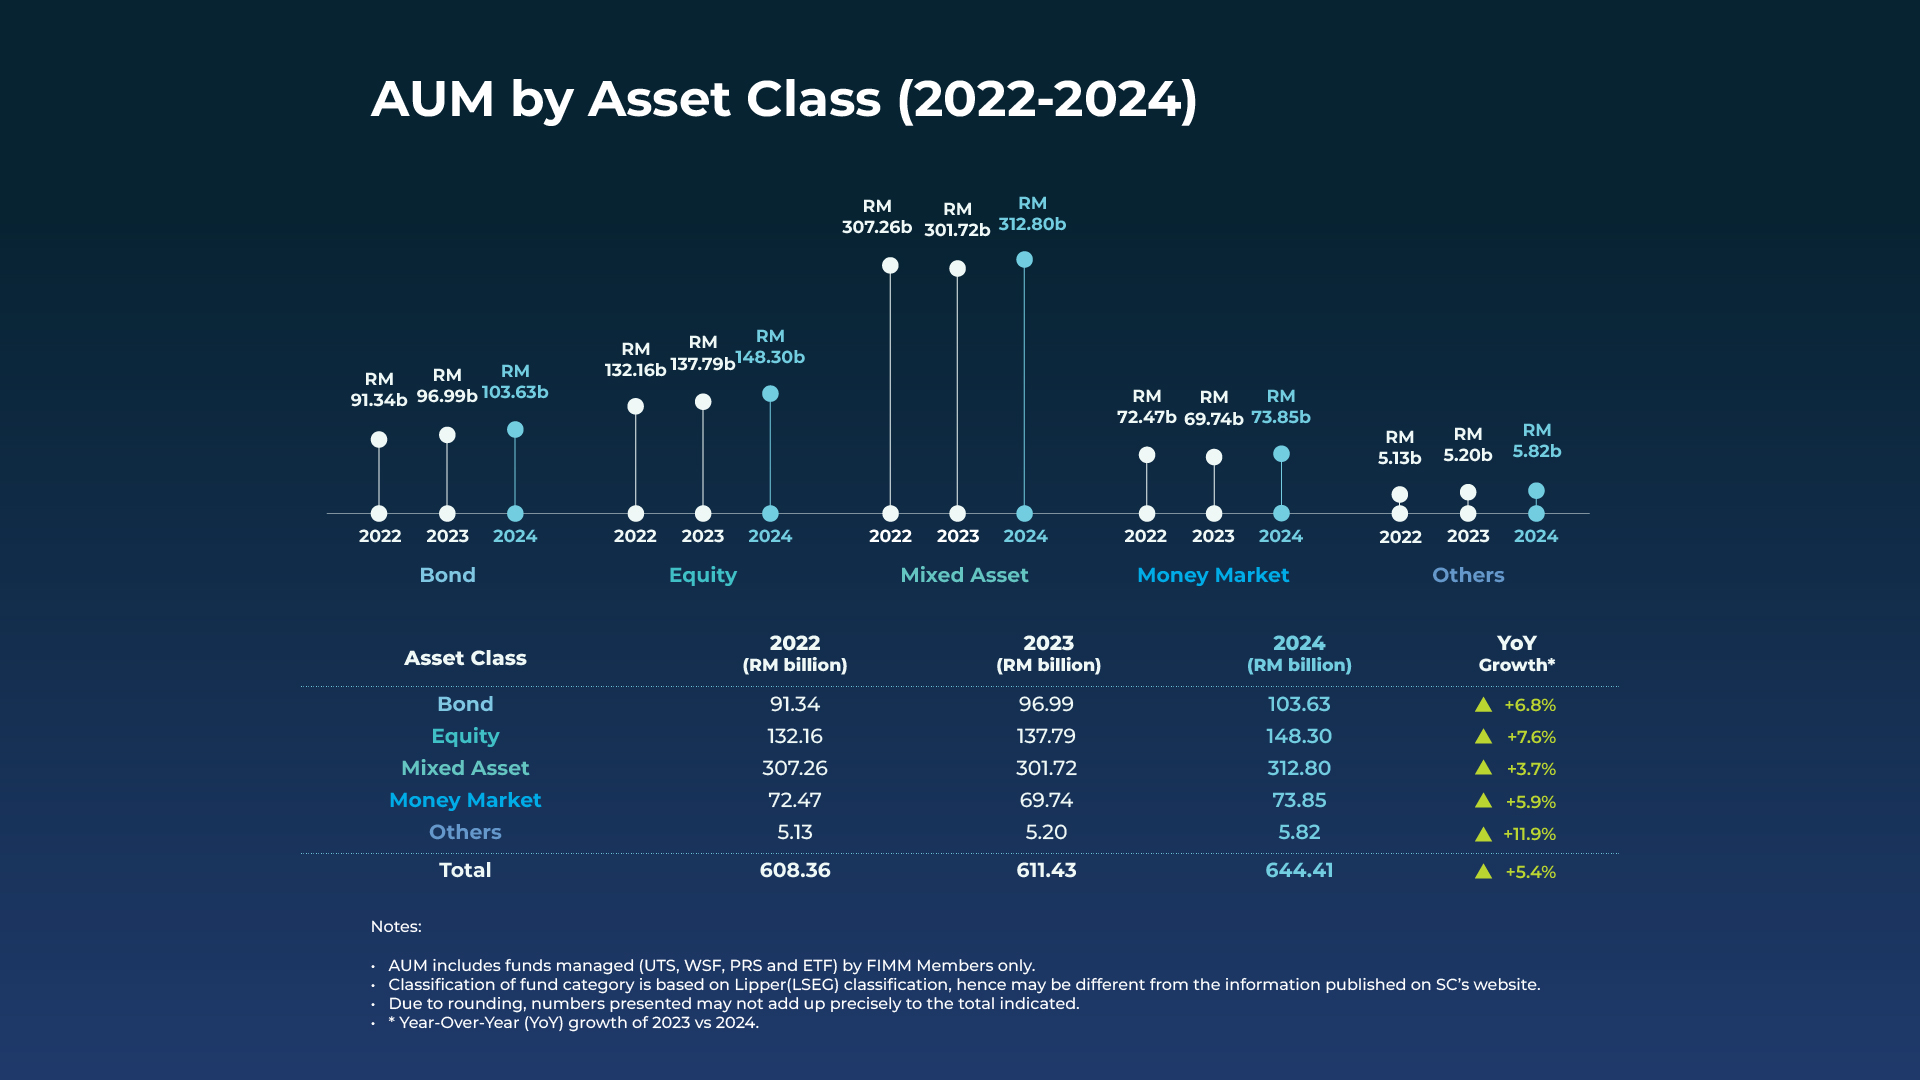
AUM by Asset Class (2022 – 2024)
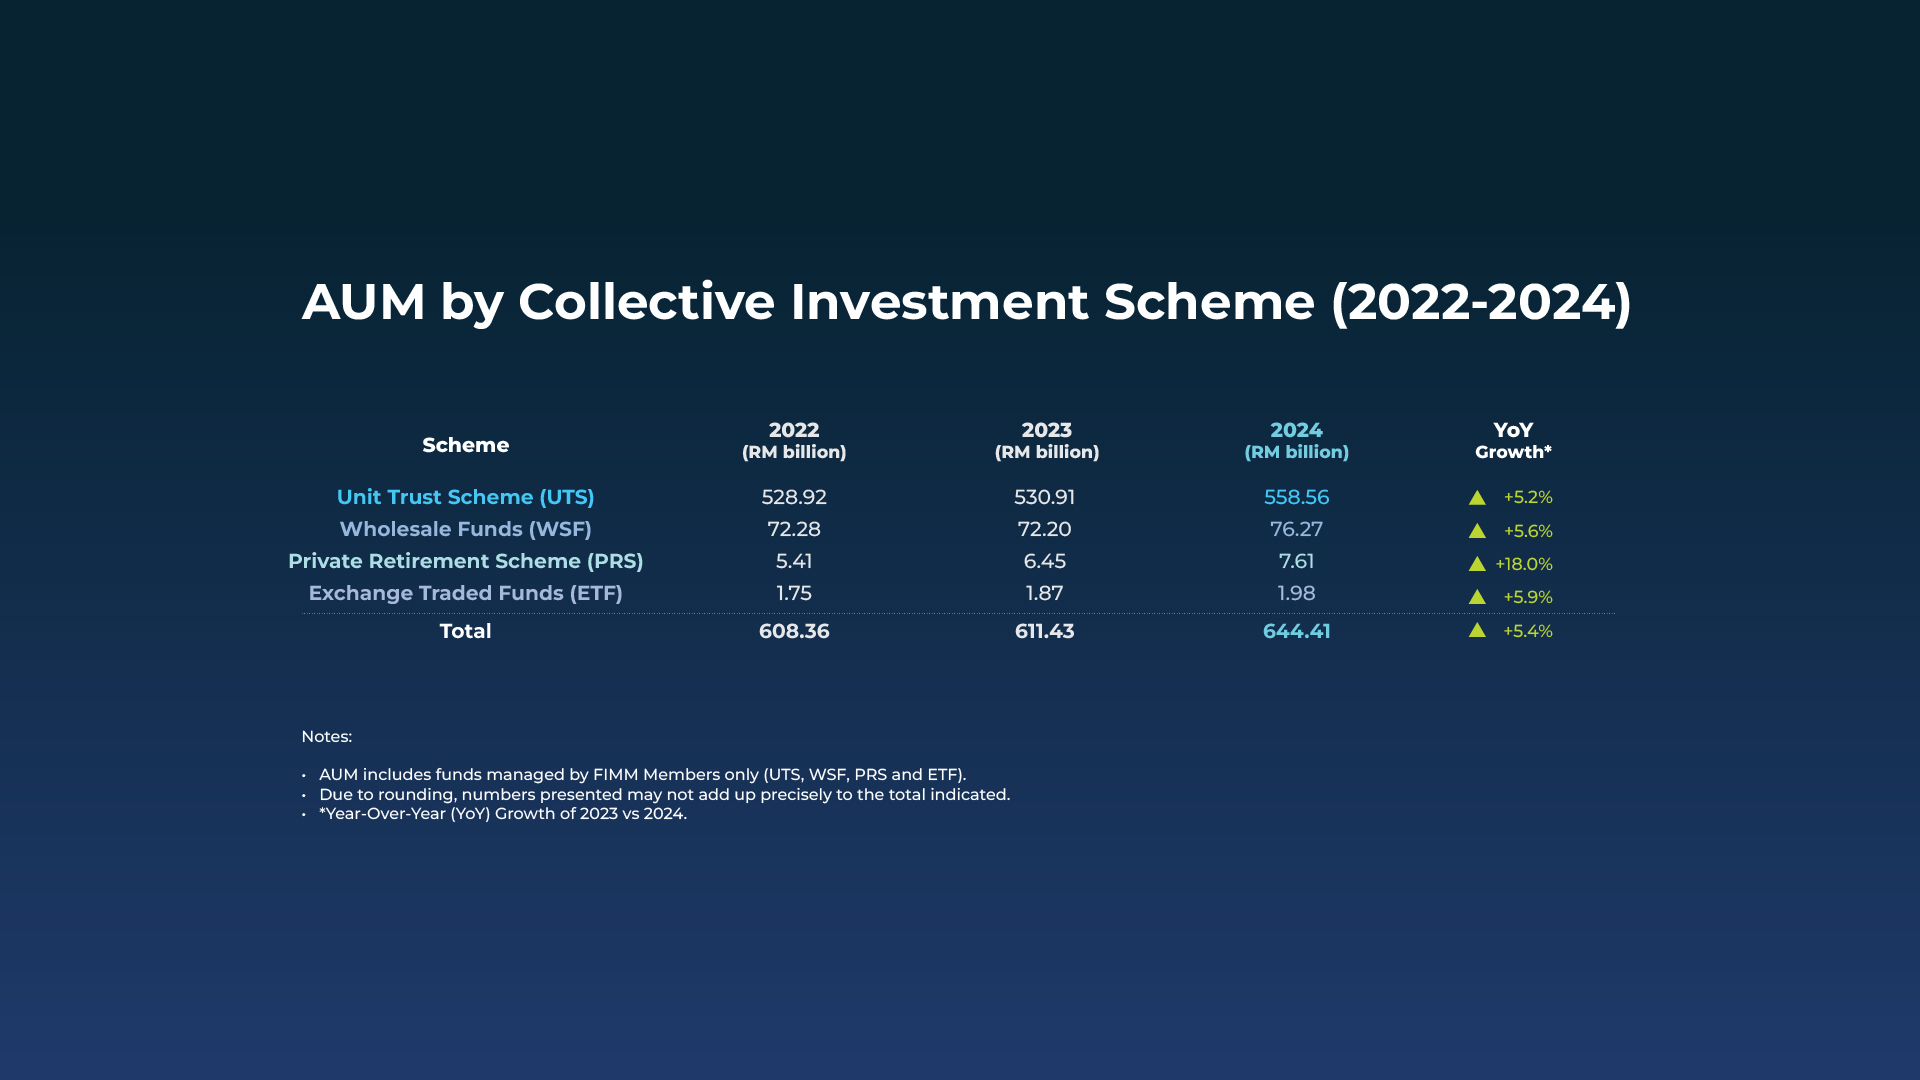
AUM by Types of Collective Investment Schemes (2022 – 2024)

AUM by Conventional & Islamic (2022 – 2024)

New Funds Launched in 2024

Assets Under Management (AUM) of Funds Managed by FIMM Members

AUM by Asset Class (2021 – 2023)

AUM by Types of Collective Investment Schemes (2021 – 2023)

AUM by Conventional & Islamic (2021 – 2023)

New Funds Launched in 2023
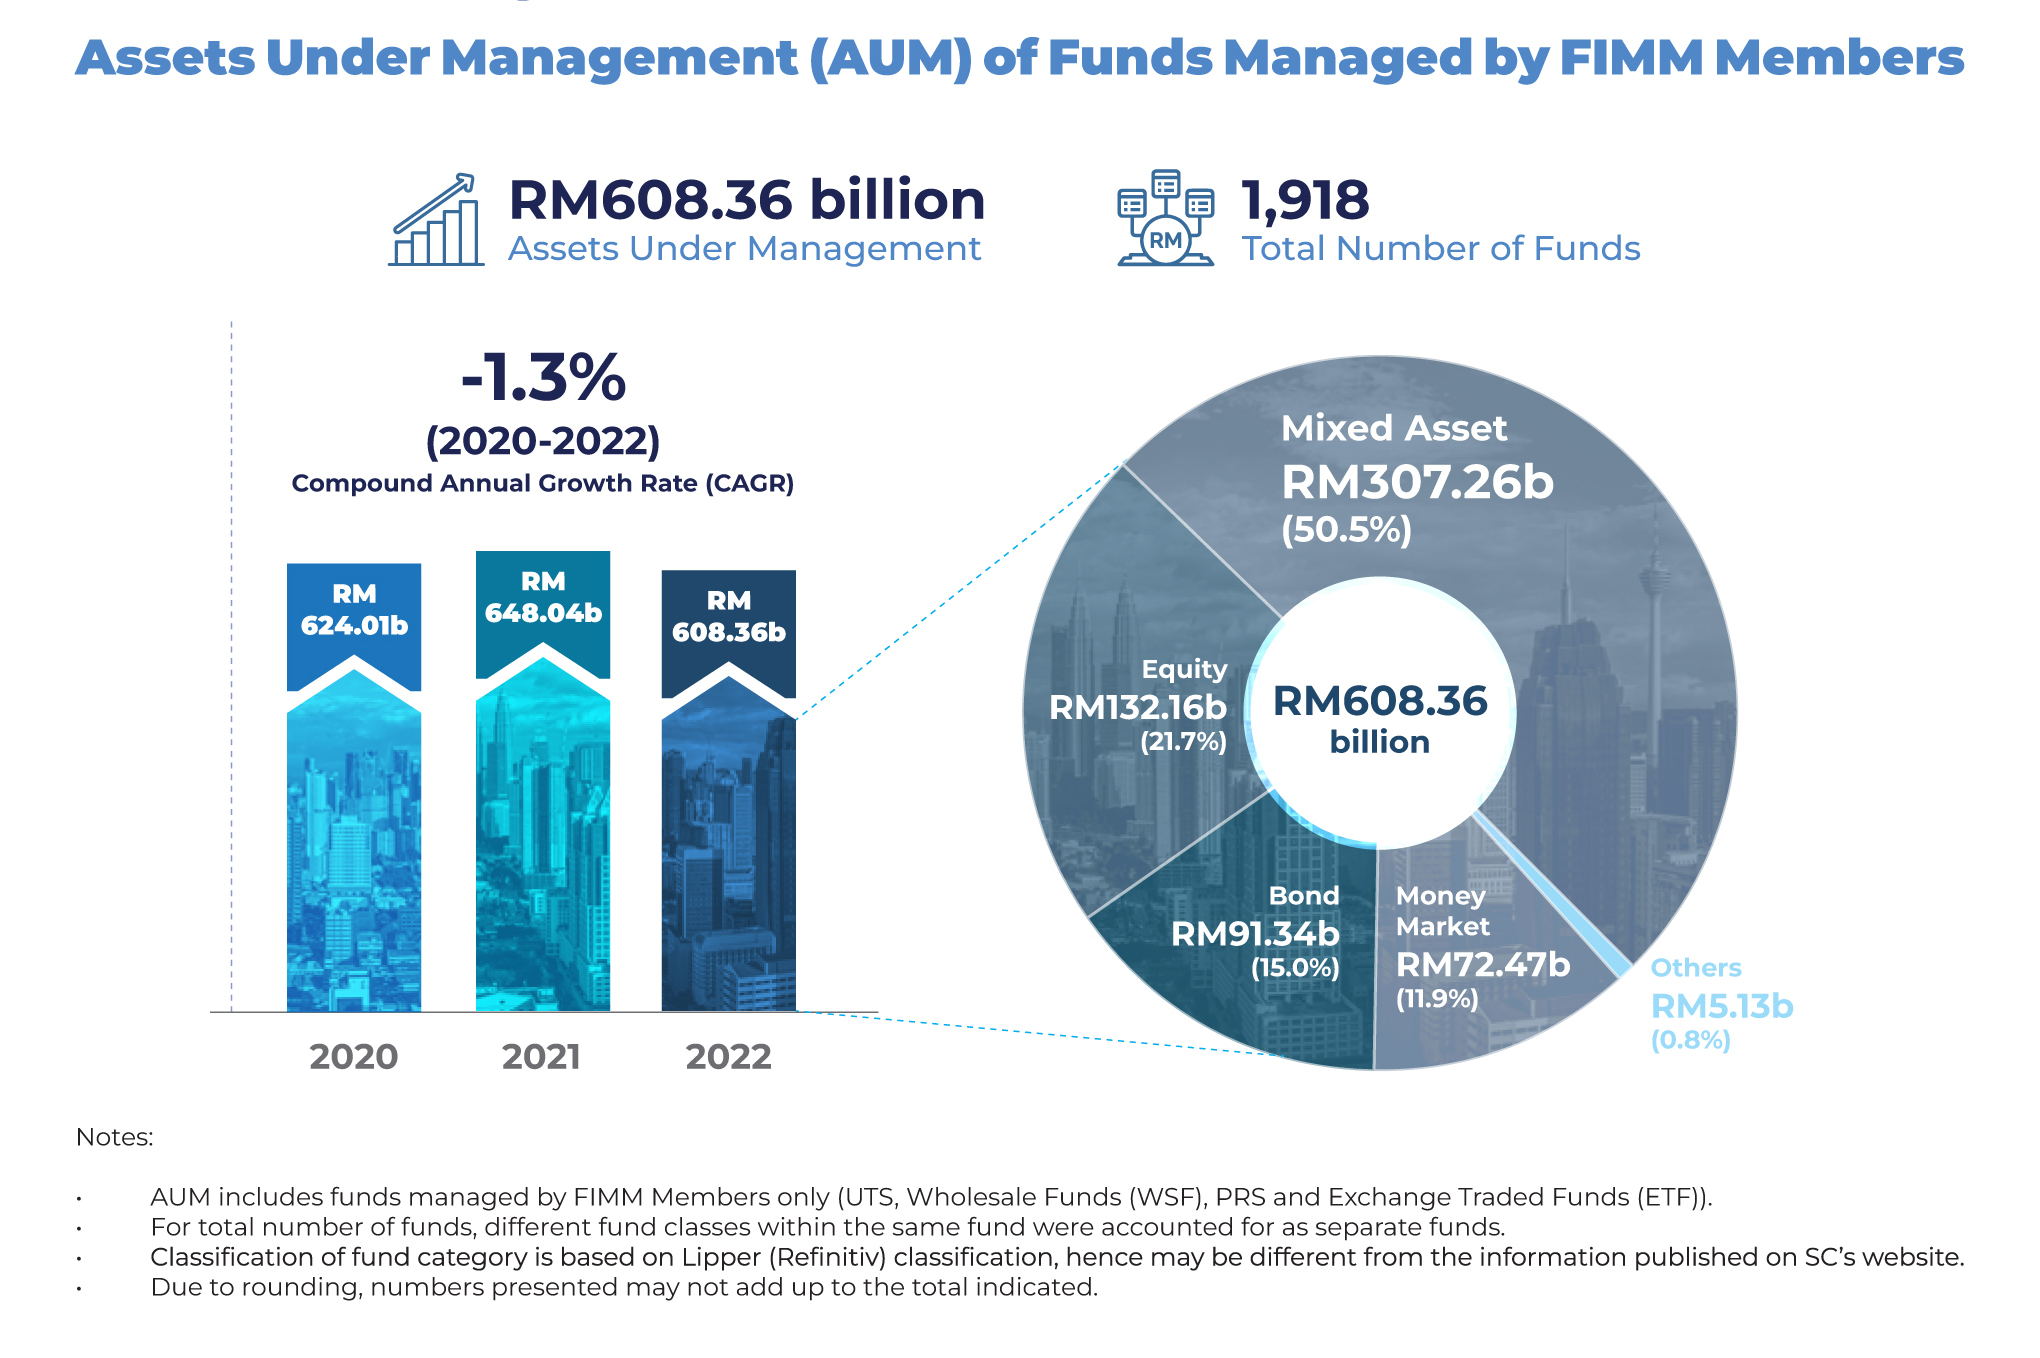
Assets Under Management (AUM) of Funds Managed by FIMM Members
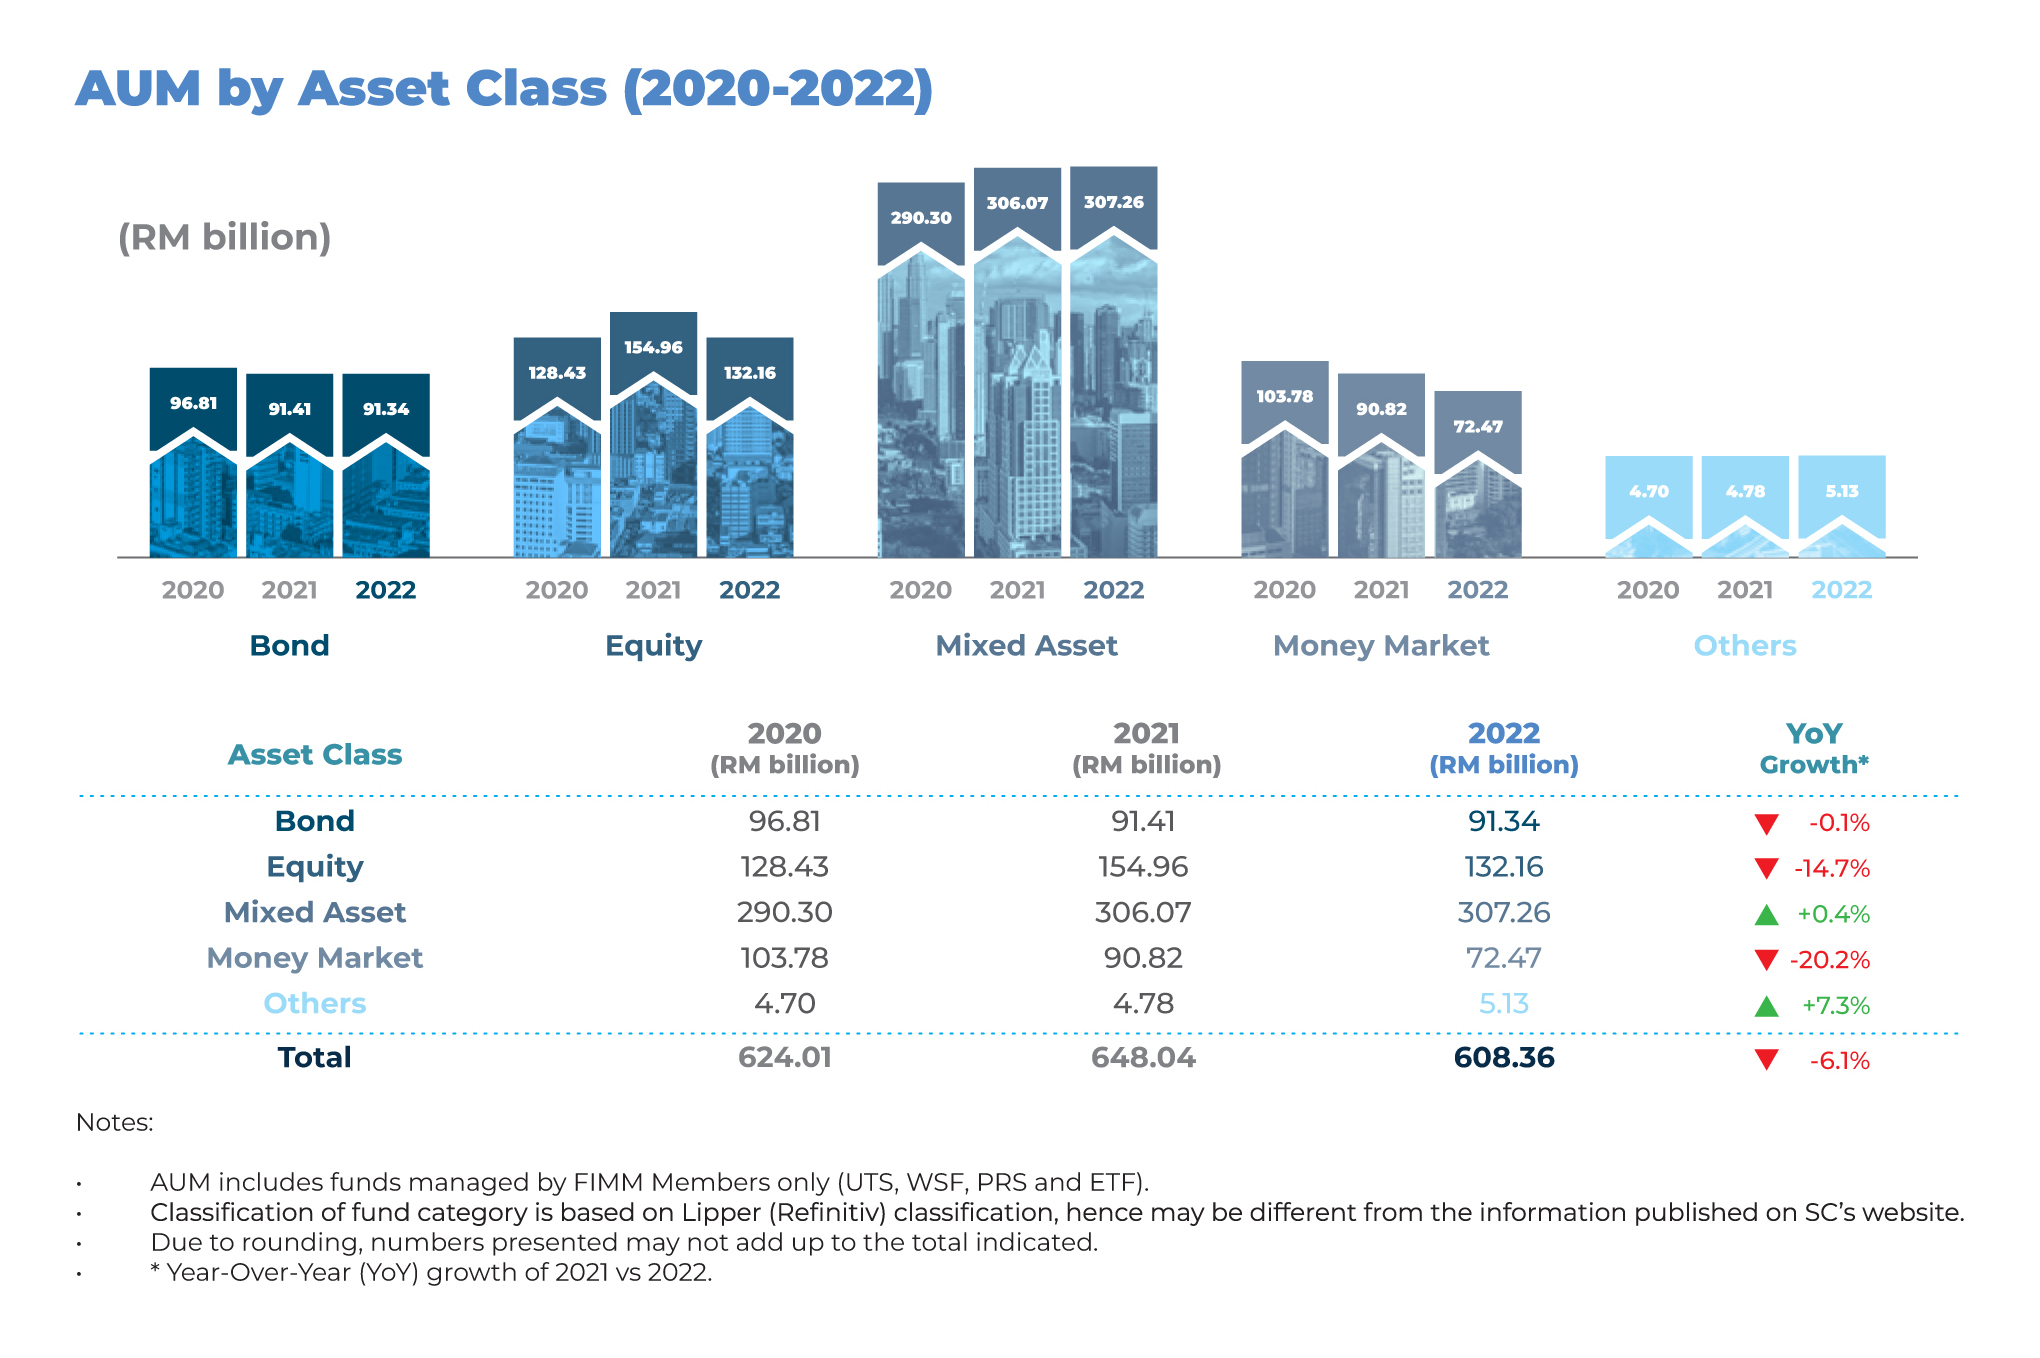
AUM by Asset Class (2020 – 2022)
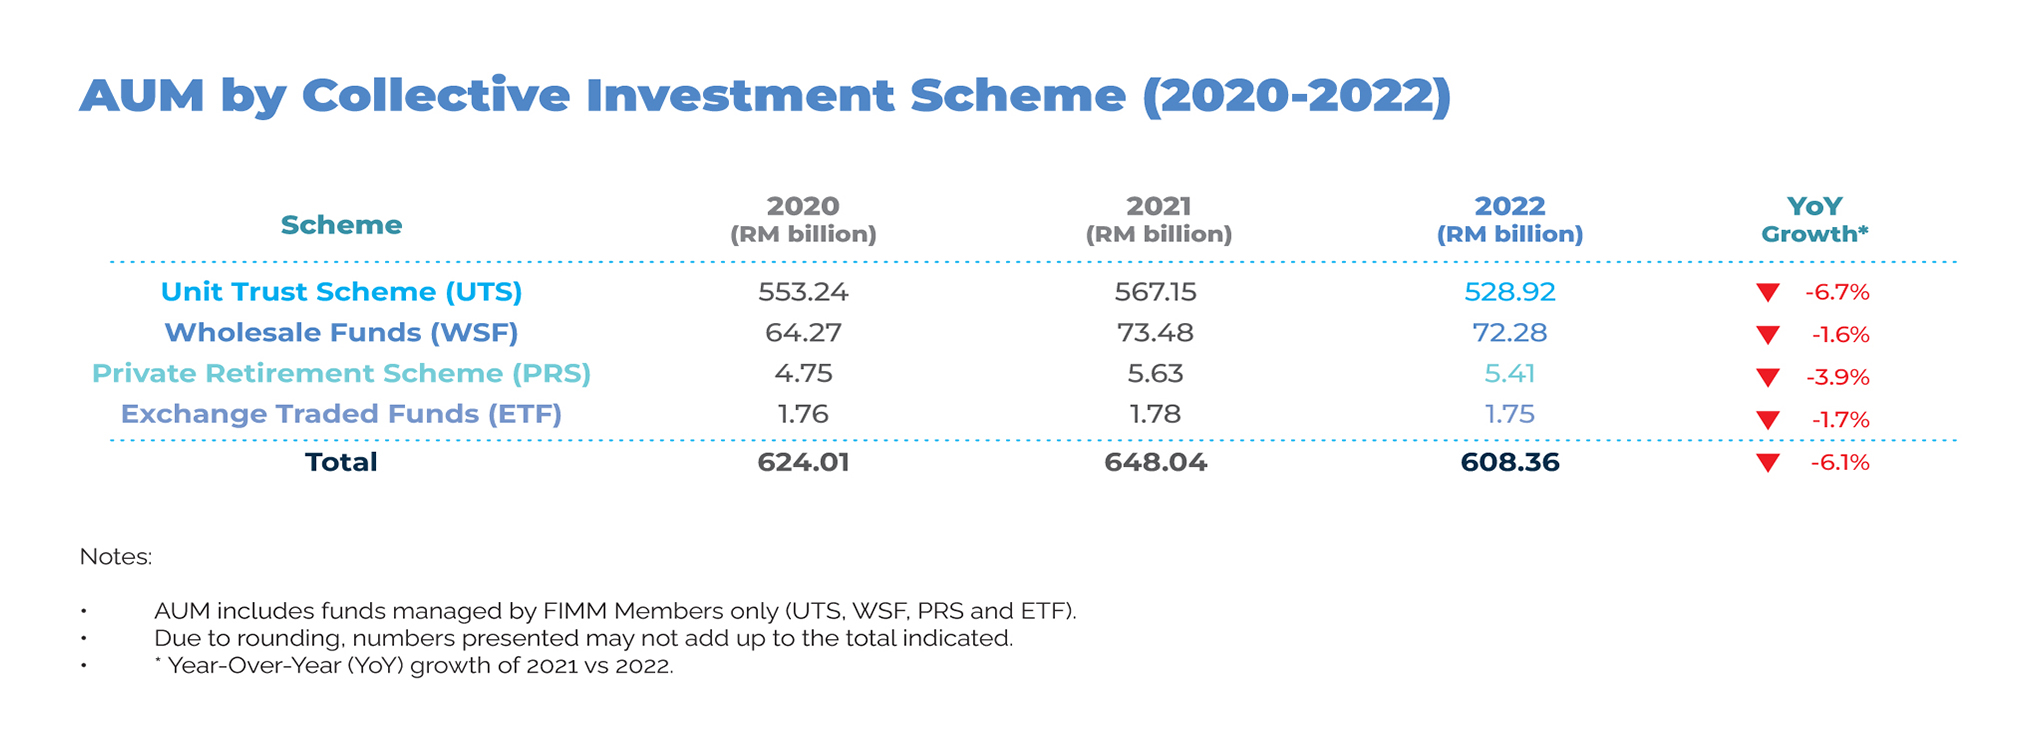
AUM by Types of Collective Investment Schemes (2020 – 2022)
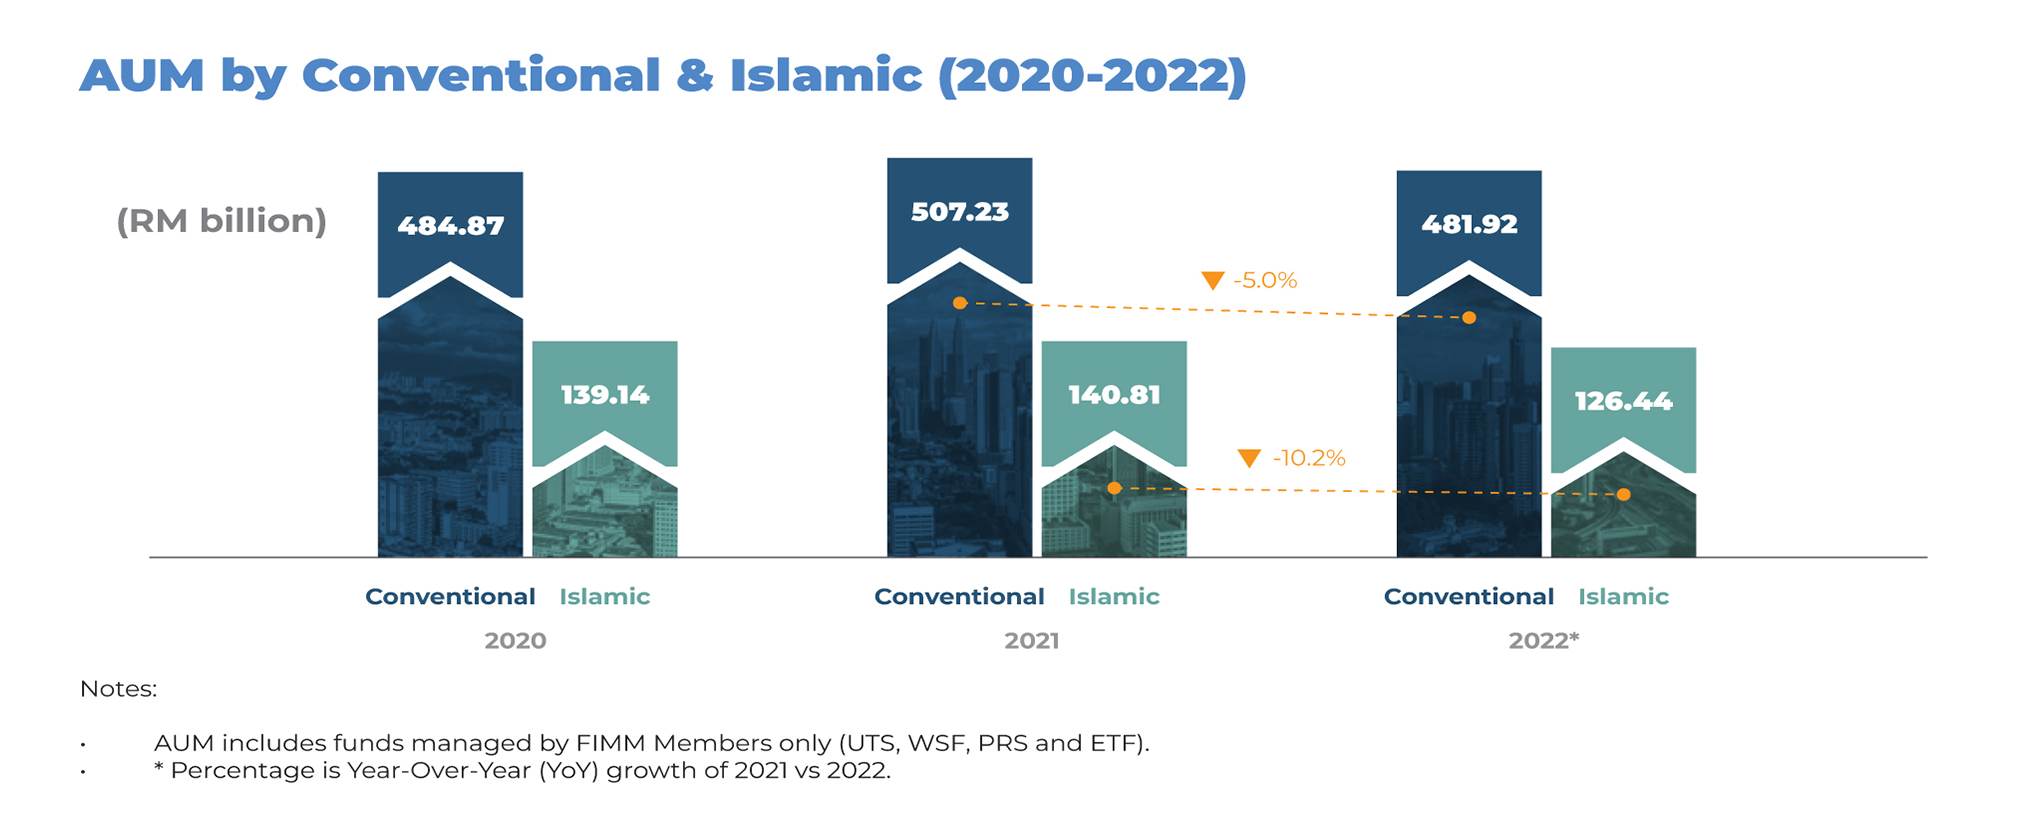
AUM by Conventional & Islamic (2020 – 2022)
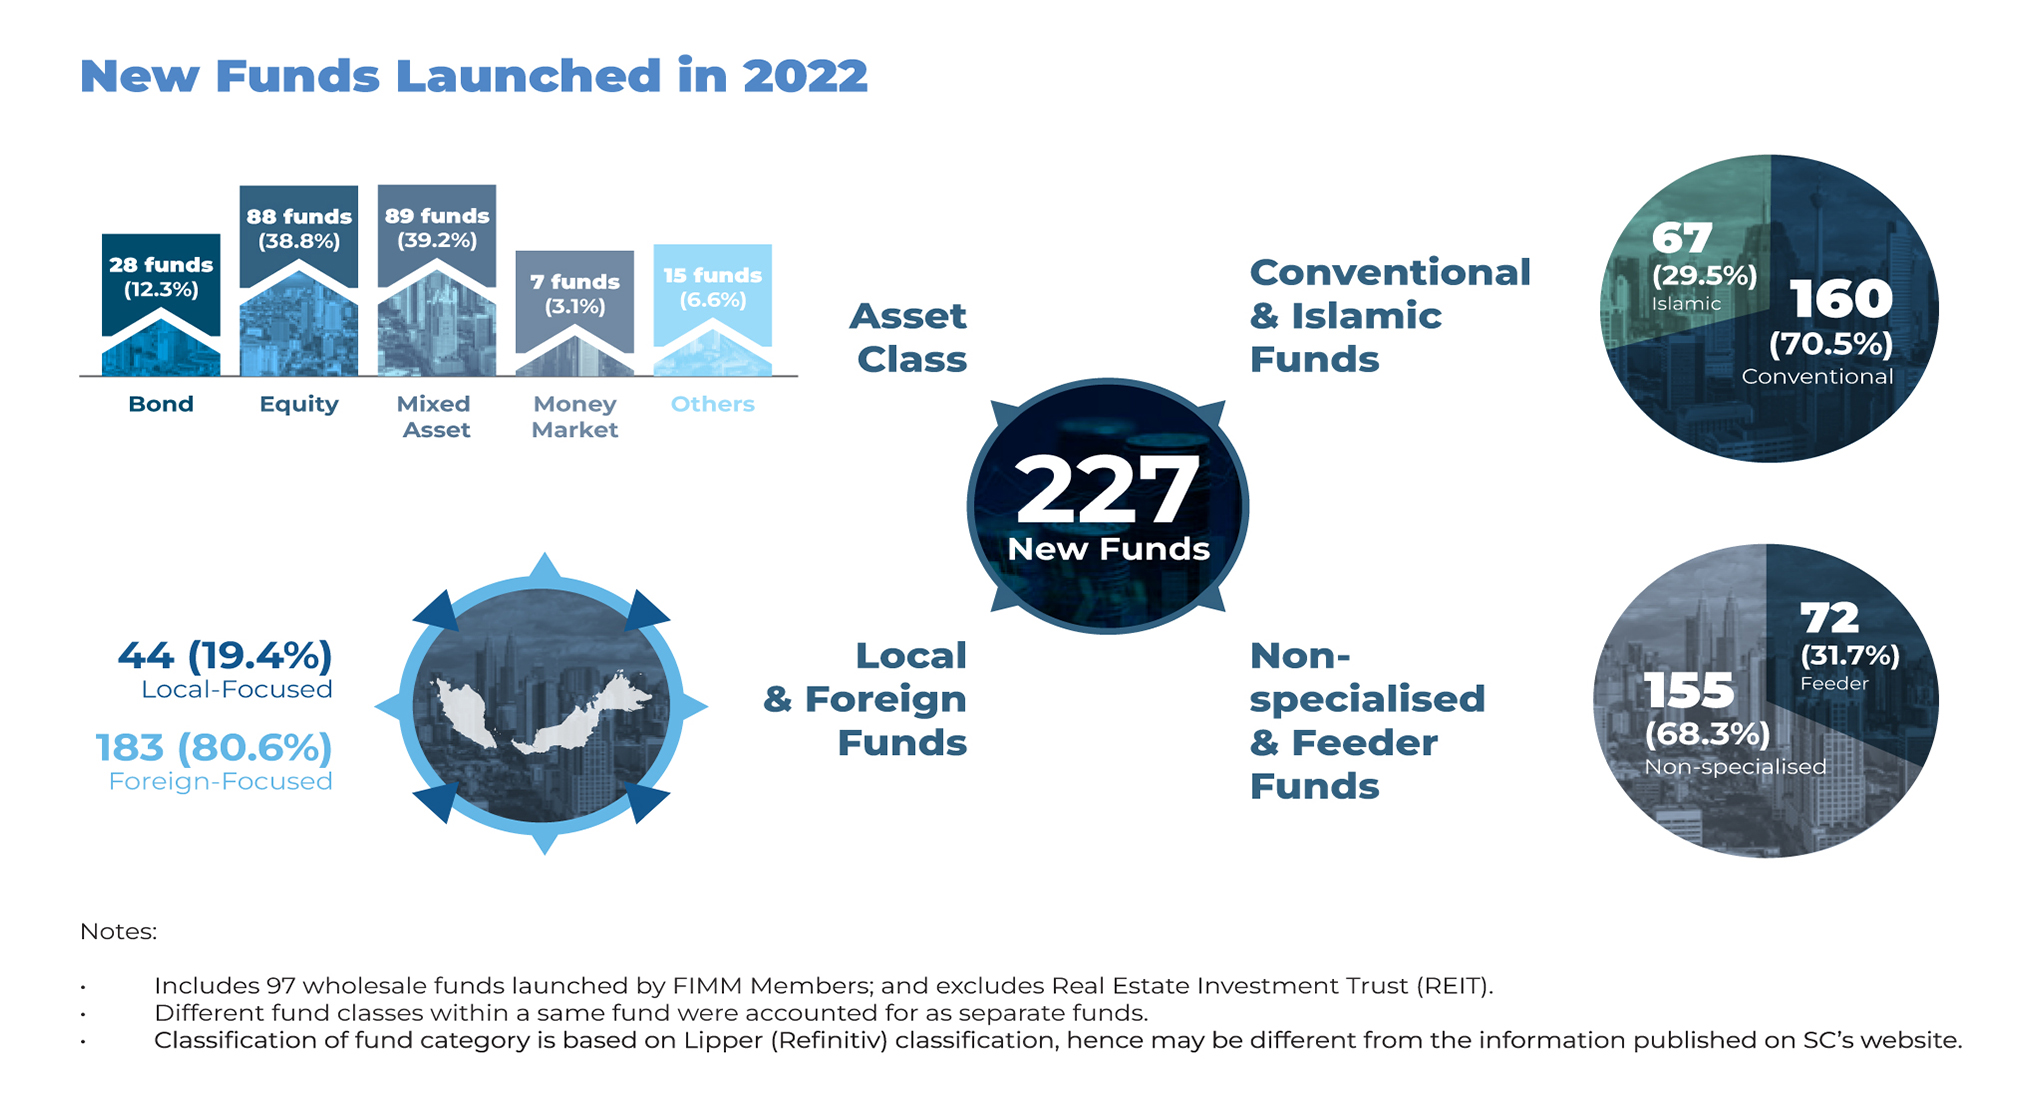
New Funds Launched in 2022

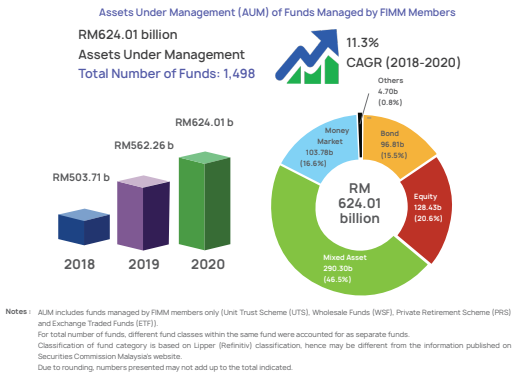
Assets Under Management (AUM) of Funds Managed by FIMM Members
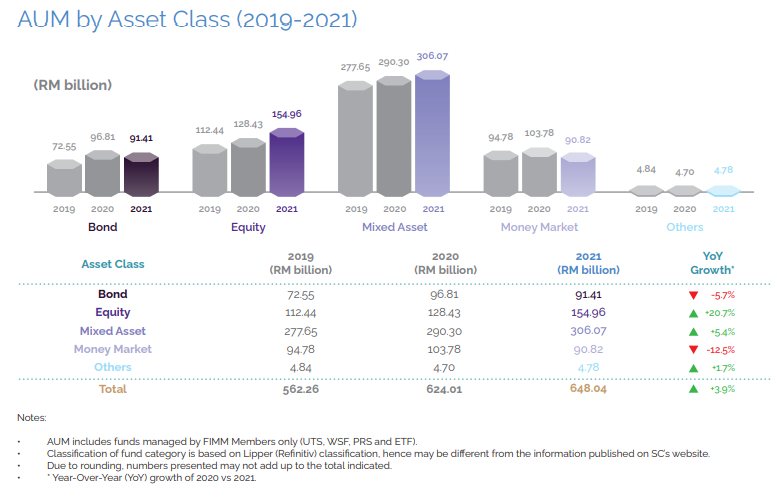
AUM by Asset Class (2019 – 2021)
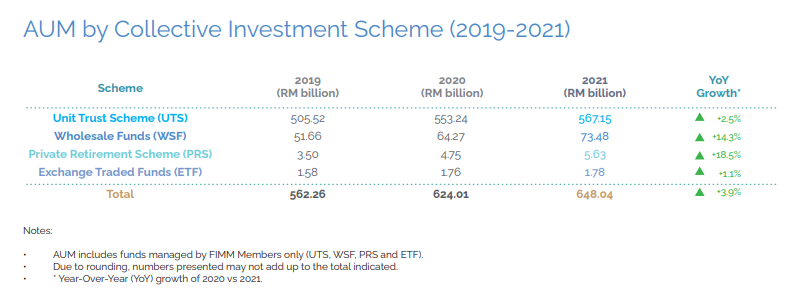
AUM by Types of Collective Investment Schemes (2019 – 2021)
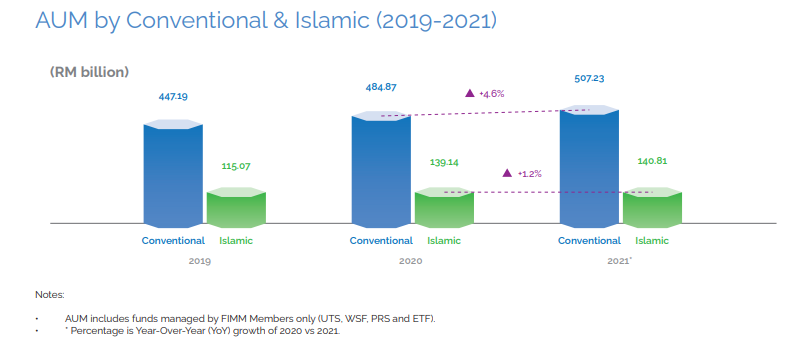
AUM by Conventional & Islamic (2019 – 2021)
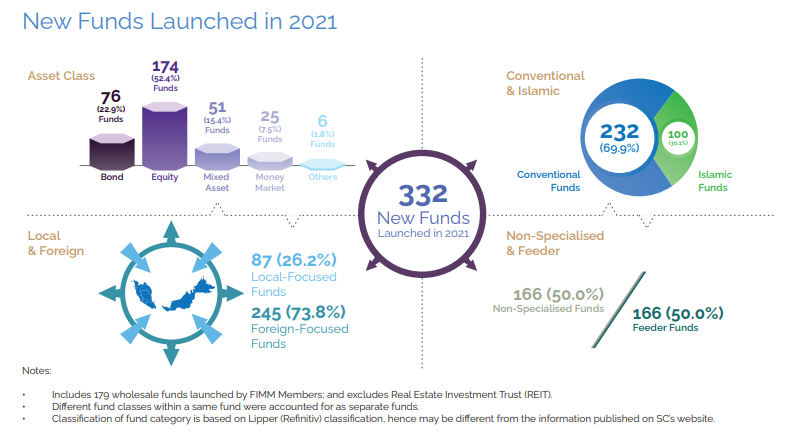
New Funds Launched in 2021
Assets Under Management (AUM) of Funds Managed by FIMM Members
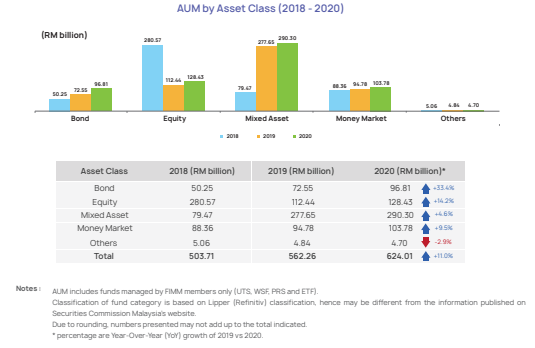
AUM by Asset Class (2018 – 2020)
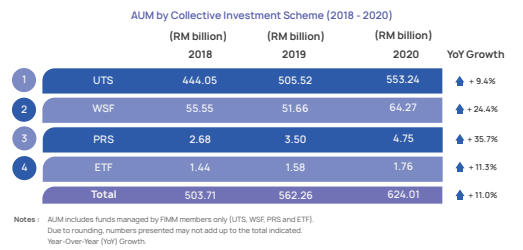
AUM by Types of Collective Investment Schemes (2018 – 2020)
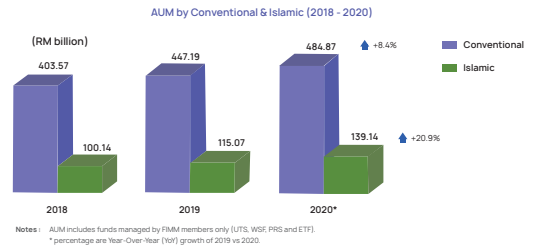
AUM by Conventional & Islamic (2018 – 2020)
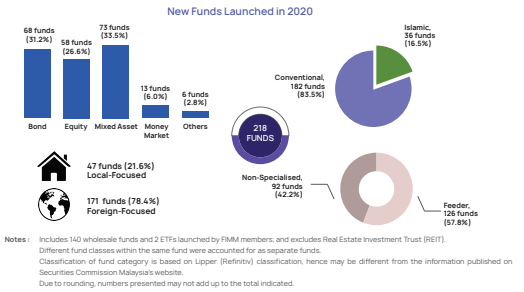
New Funds Launched in 2020
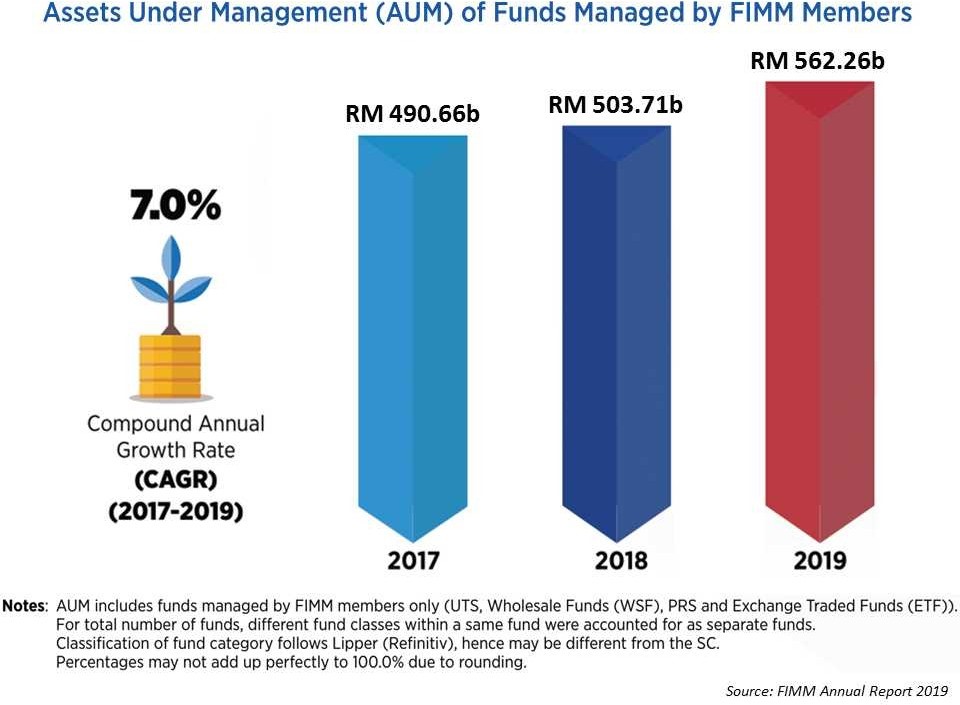
Assets Under Management (AUM) of Funds Managed by FIMM Members
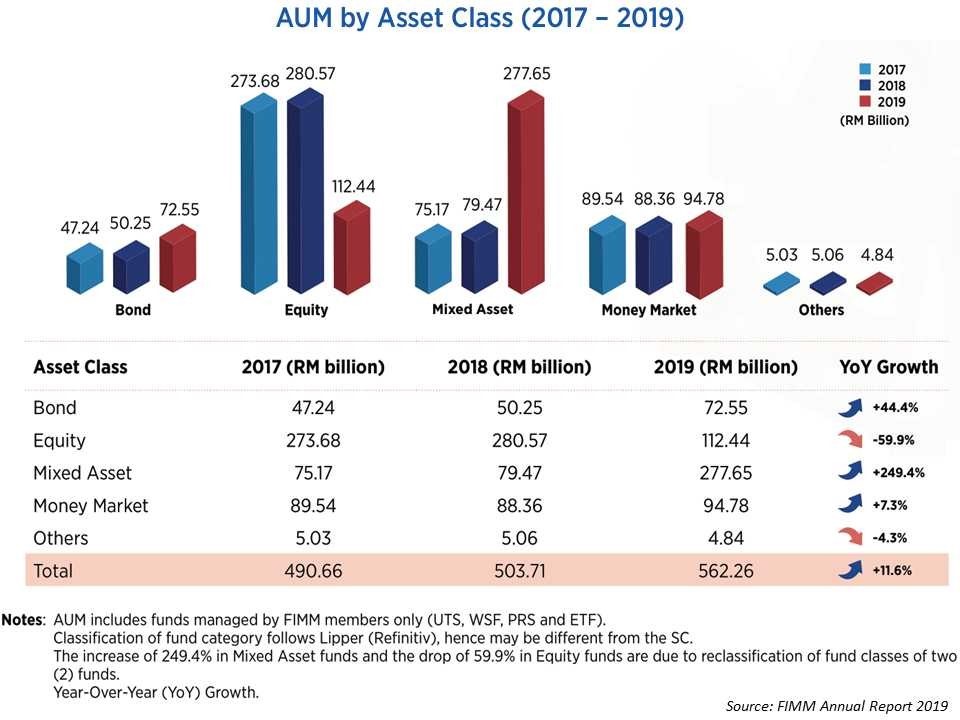
AUM by Asset Class (2017 – 2019)
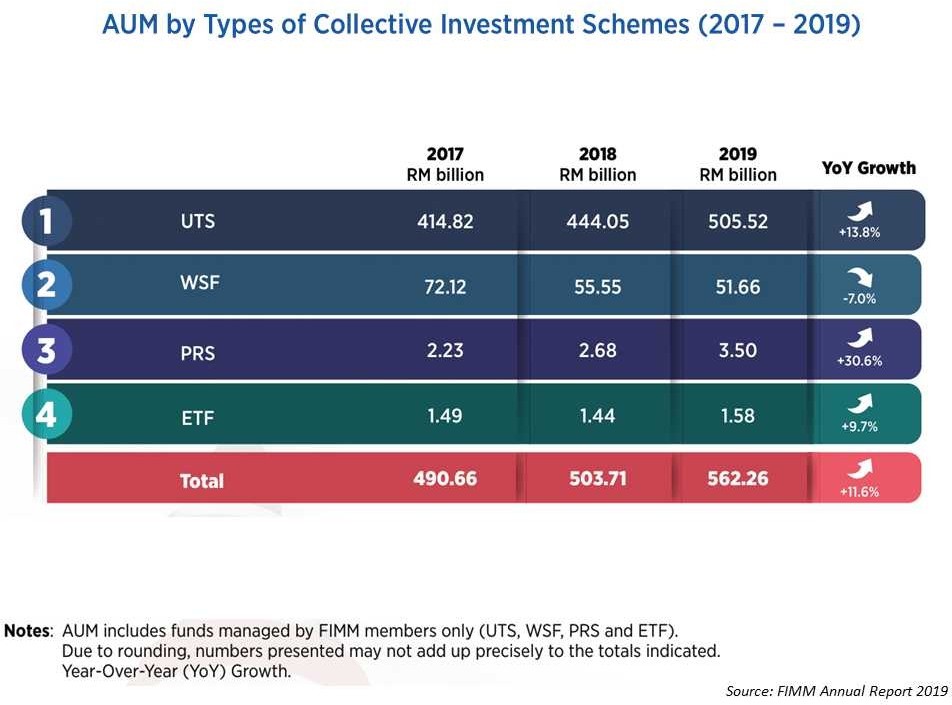
AUM by Types of Collective Investment Schemes (2017 – 2019)
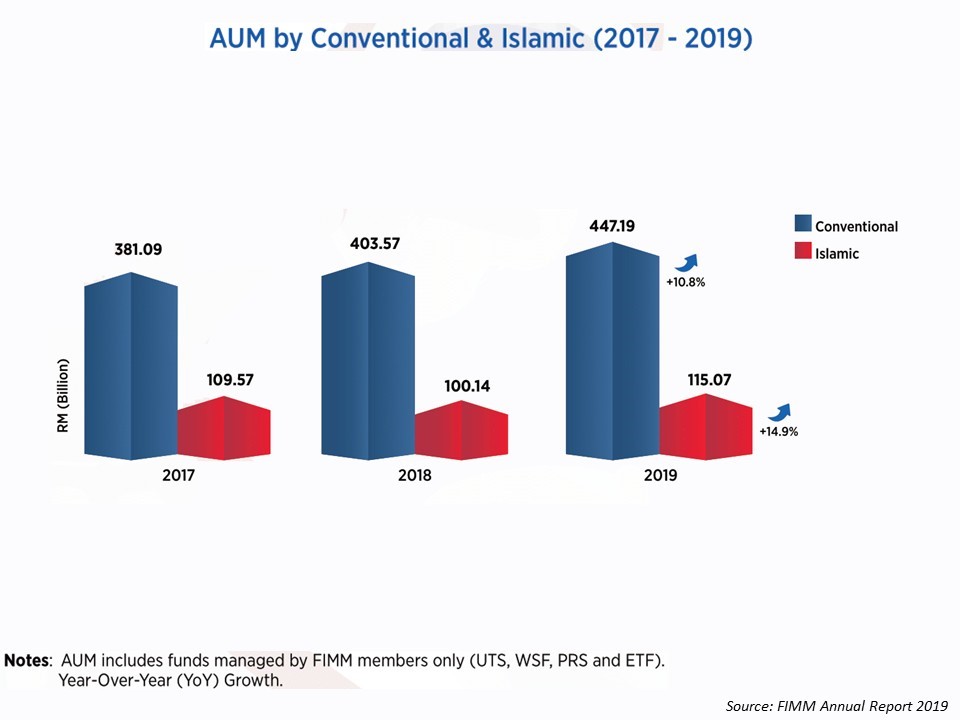
AUM by Conventional & Islamic (2017 – 2019)
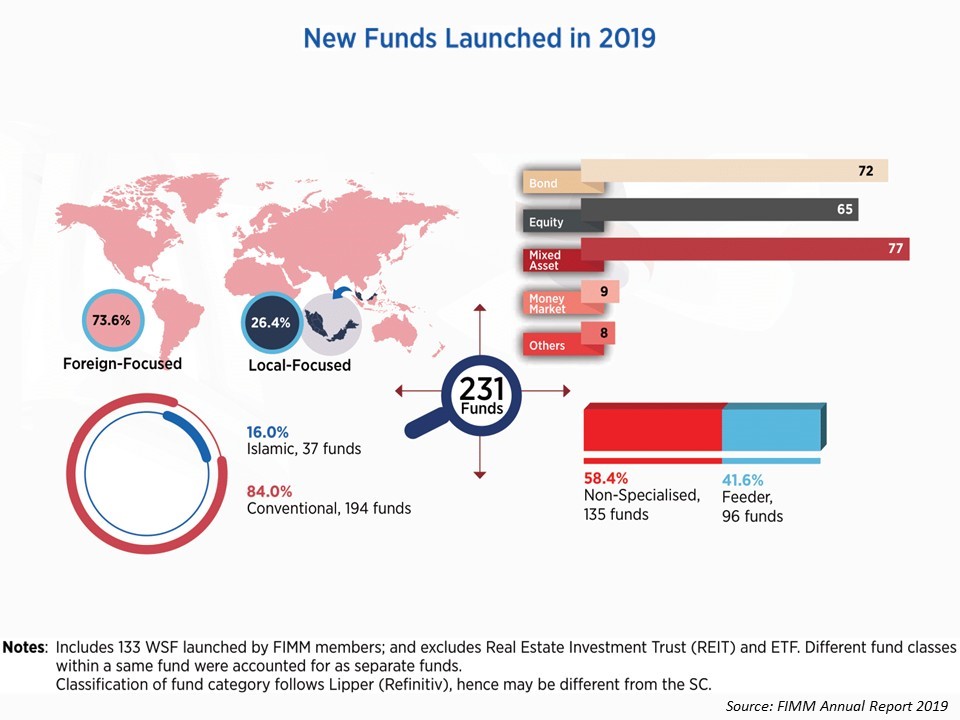
New Funds Launched in 2019
| Summary of Statistics (As at 31 May 2026) | |
|---|---|
| No. of Authorised Funds*
– Conventional – Shariah-compliant |
783 |
| 476 | |
| 307 | |
| No. of Launched Funds
– Conventional – Shariah-compliant |
773 |
| 469 | |
| 304 | |
| Units in Circulation (billion units)
– Conventional – Shariah-compliant |
785.075 |
| 574.864 | |
| 210.211 | |
| No. of Accounts #
– Conventional – Shariah-compliant |
27,957,377 |
| 20,219,720 | |
| 7,737,657 | |
| Total NAV of Funds (RM billion)
– Conventional – Shariah-compliant |
630.831 |
| 482.154 | |
| 148.677 | |
Note:- The above statistics does not include statistics for wholesale funds effective January 2009
* Includes funds authorised but pending launch
# Does not include unitholders accounts at IUTA that operate under a nominee account system
Source: Securities Commission Malaysia
| As at Month End | Feb-26 | Mar-26 | Apr-26 |
| No. of Authorised Funds*
– Conventional – Shariah-compliant |
781 | 779 | 783 |
| 473 | 472 | 475 | |
| 308 | 307 | 308 | |
| No. of Launched Funds
– Conventional – Shariah-compliant |
767 | 767 | 771 |
| 465 | 467 | 468 | |
| 302 | 300 | 303 | |
| Units in Circulation (billion units)
– Conventional – Shariah-compliant |
785.725 | 786.838 | 787.301 |
| 574.372 | 575.204 | 577.446 | |
| 211.353 | 211.634 | 209.855 | |
| No. of Accounts #
– Conventional – Shariah-compliant |
27,512,343 | 27,648,957 | 27,819,990 |
| 19,925,218 | 20,016,633 | 20,147,282 | |
| 7,587,125 | 7,632,324 | 7,672,708 | |
| Total NAV of Funds (RM billion)
– Conventional – Shariah-compliant |
605.865 | 591.270 | 618.244 |
| 467.337 | 456.312 | 475.394 | |
| 138.528 | 134.958 | 142.850 |
Note:- The above statistics does not include statistics for wholesale funds effective January 2009
- * Includes funds authorised but pending launch
- # Does not include unitholders accounts at IUTA that operate under a nominee account system
- Reported numbers have been adjusted to reflect the subsequent updates submitted by intermediaries
Source: Securities Commission Malaysia
Exam Statistics
Q1
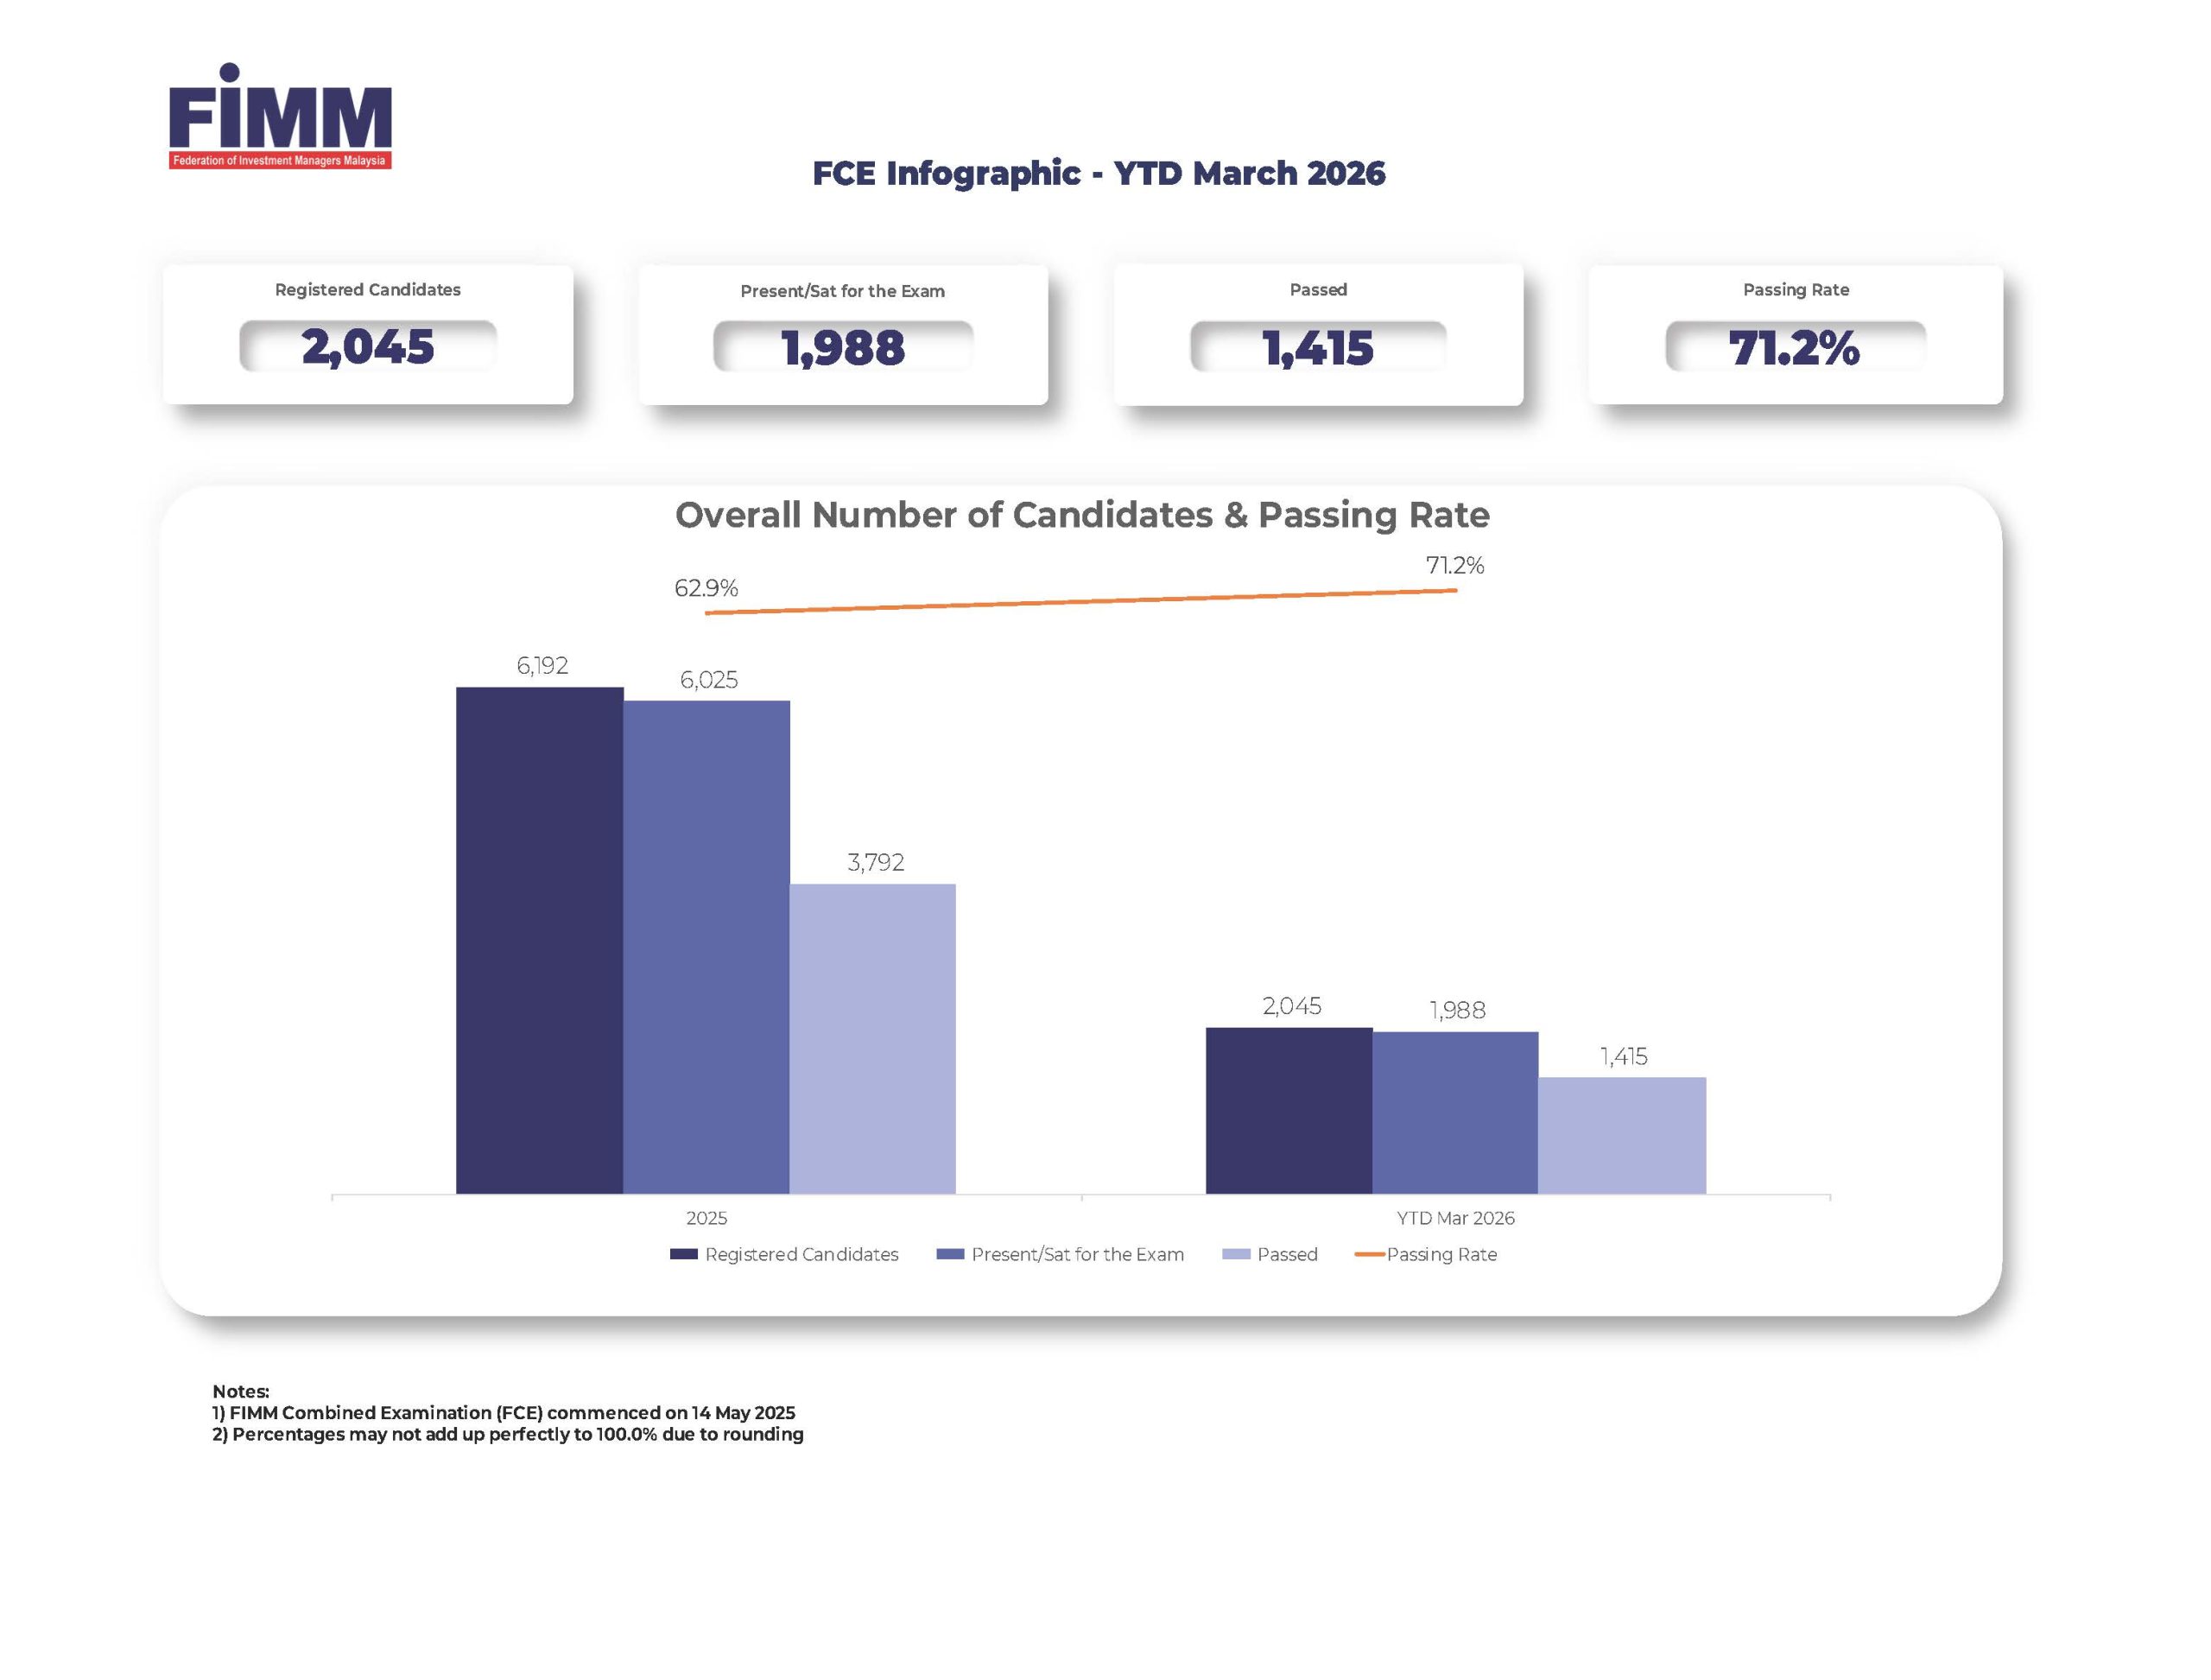
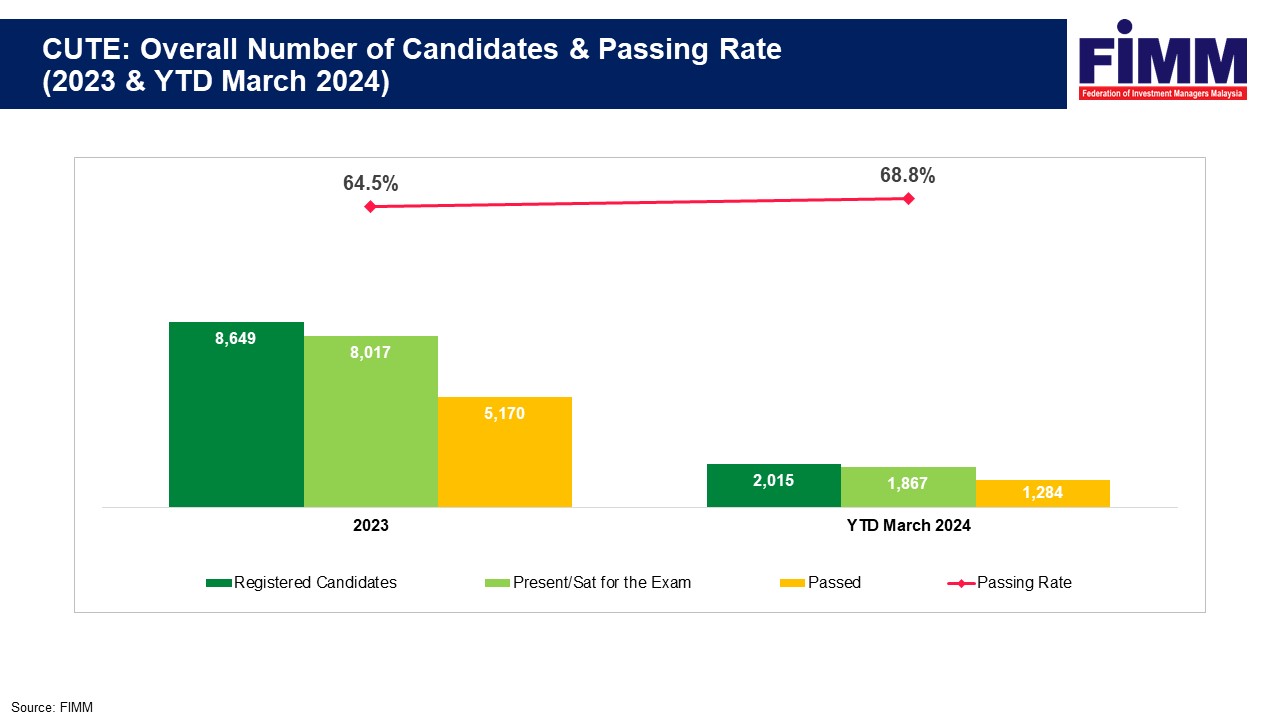
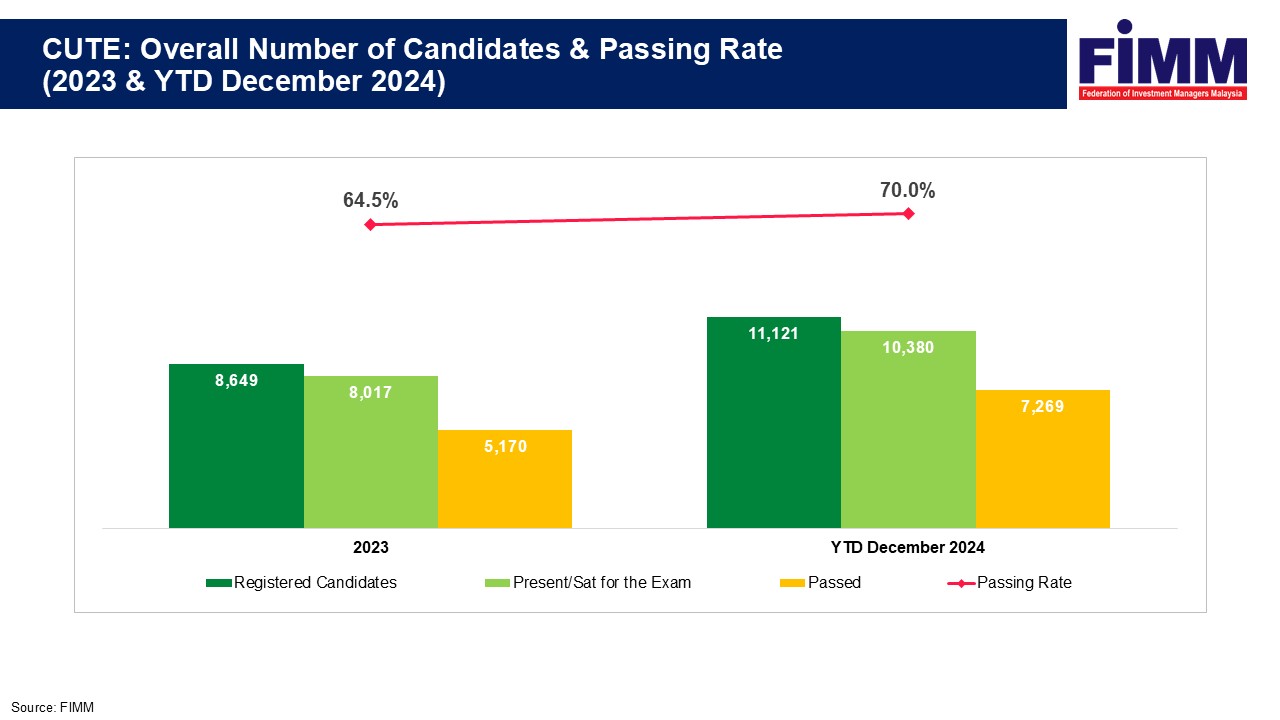
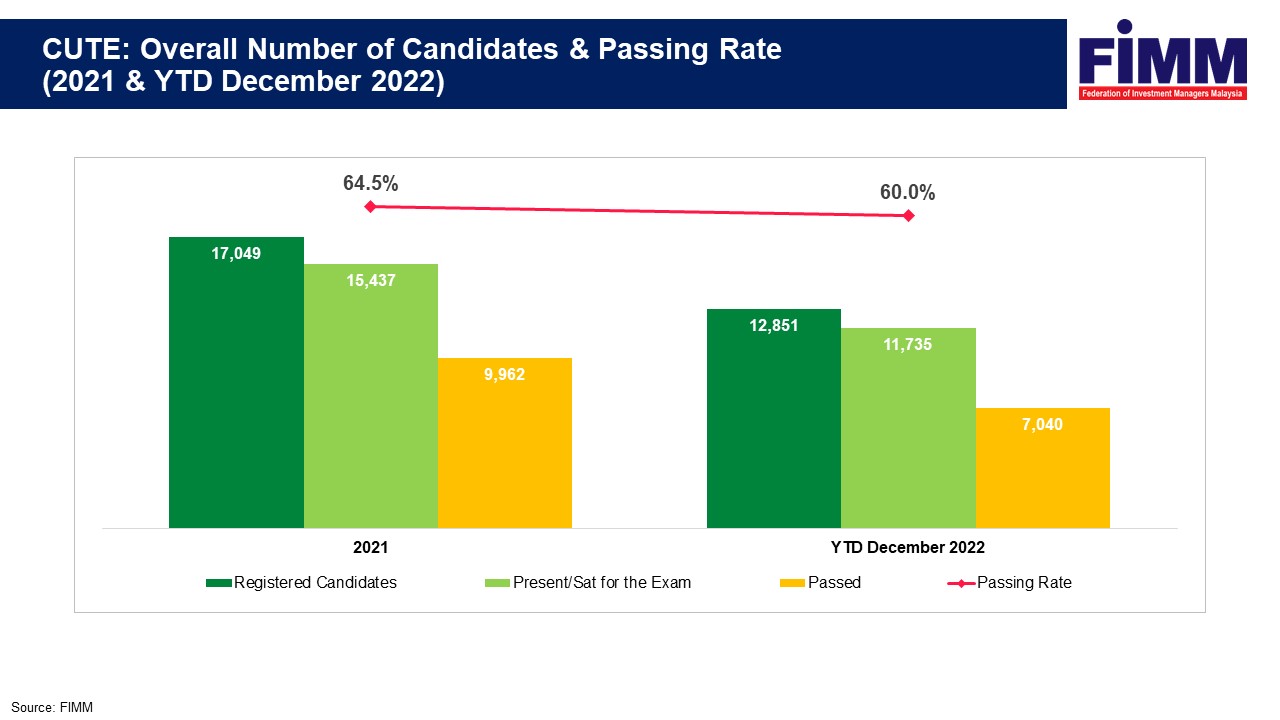
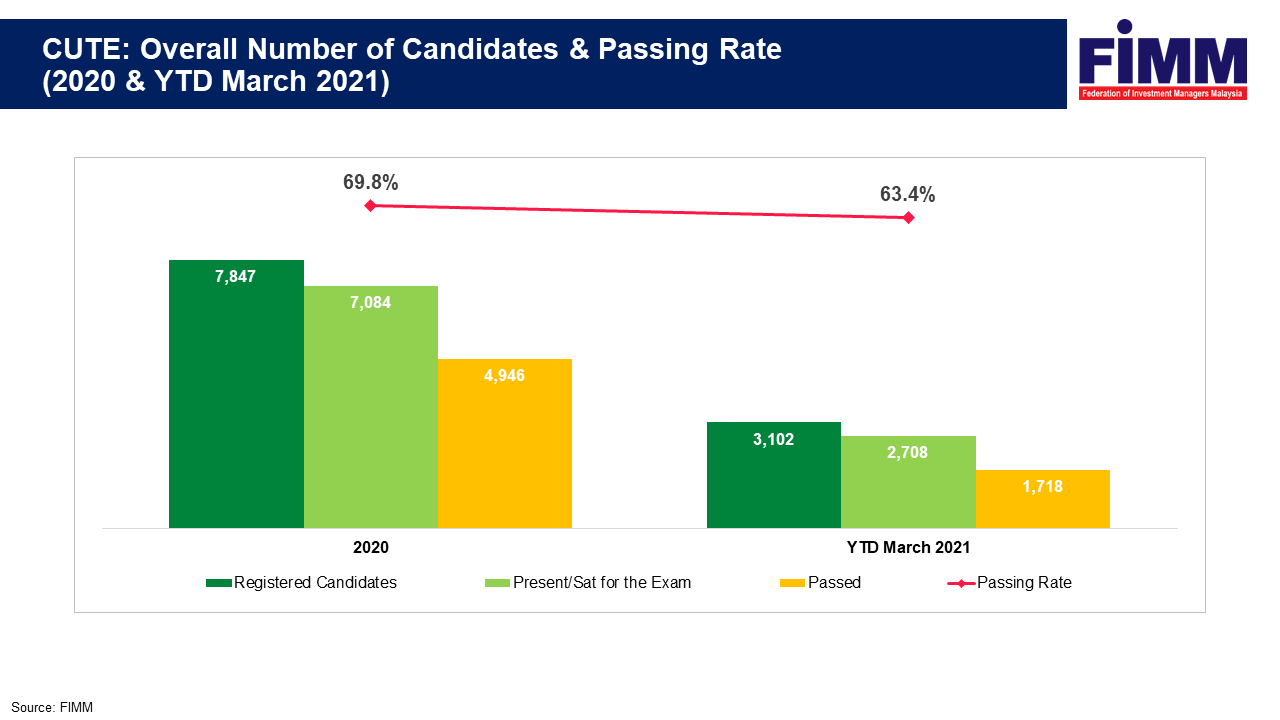
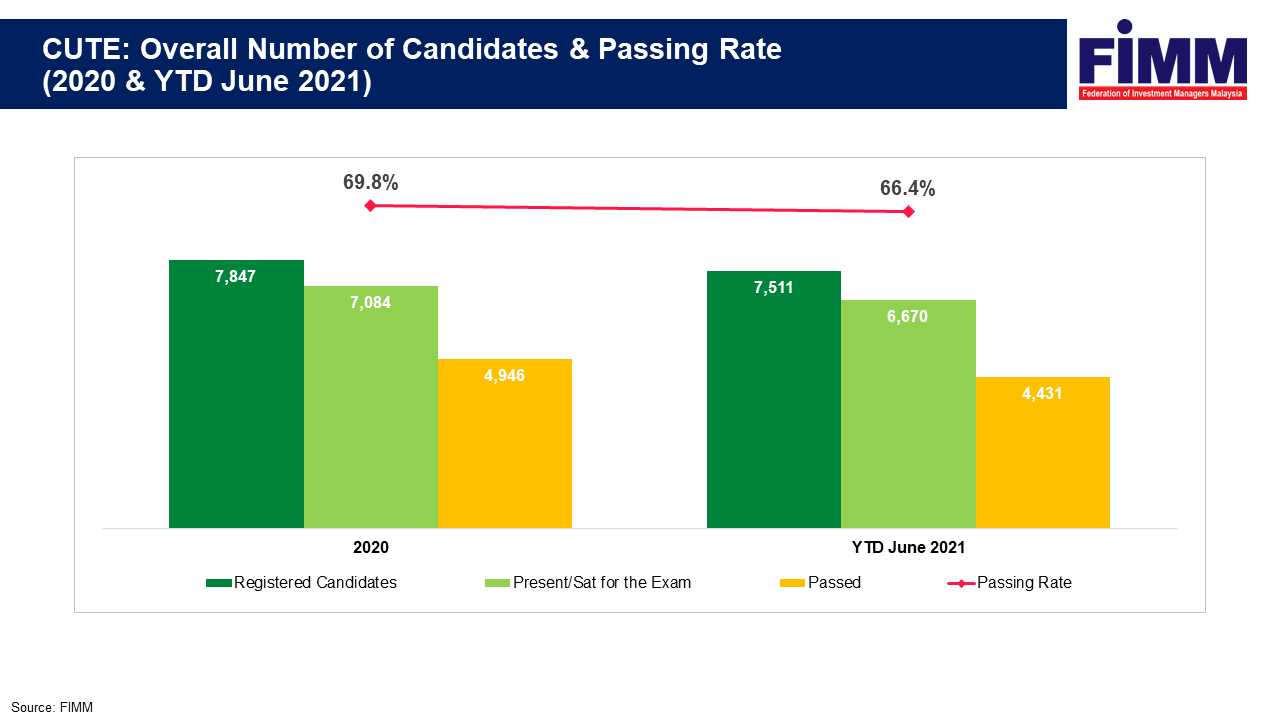
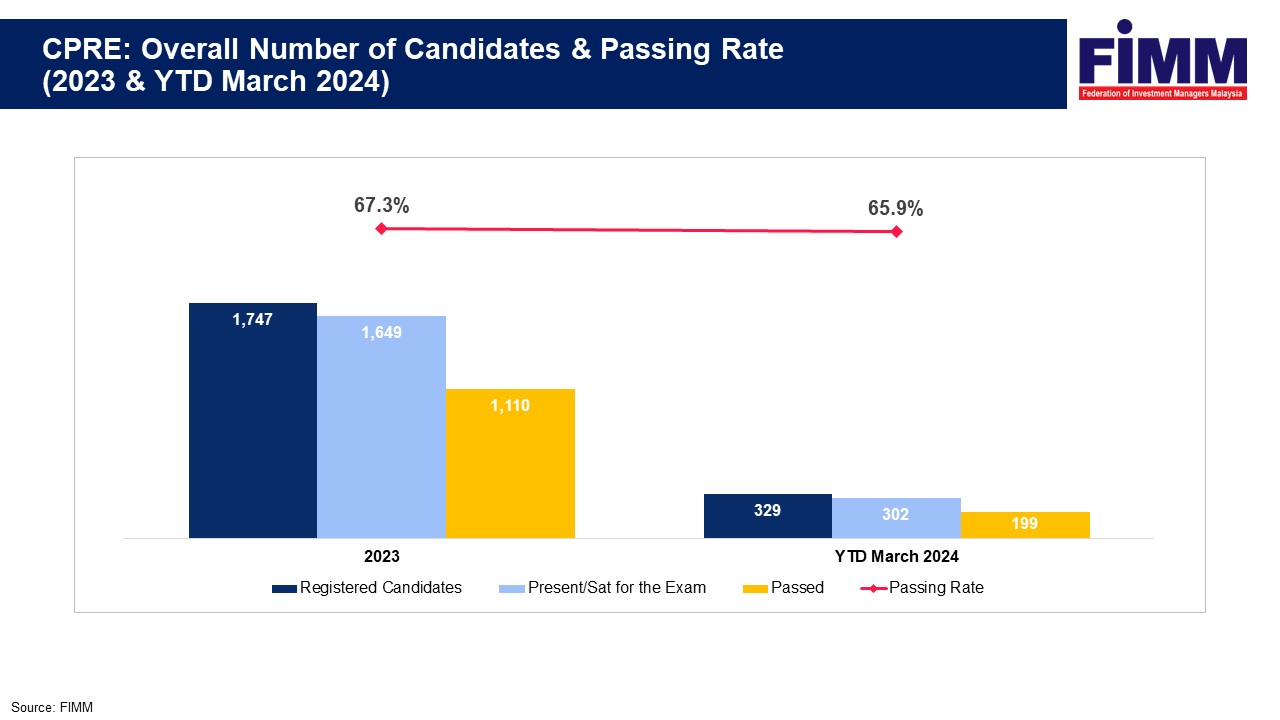
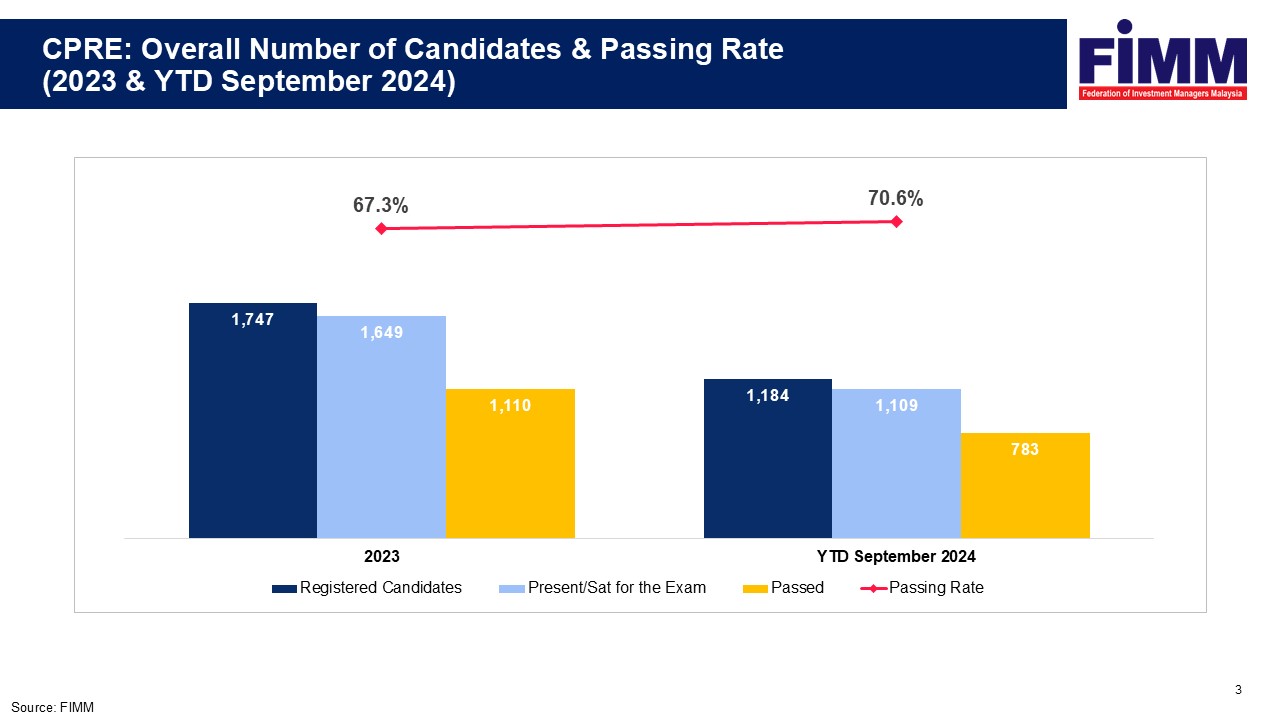
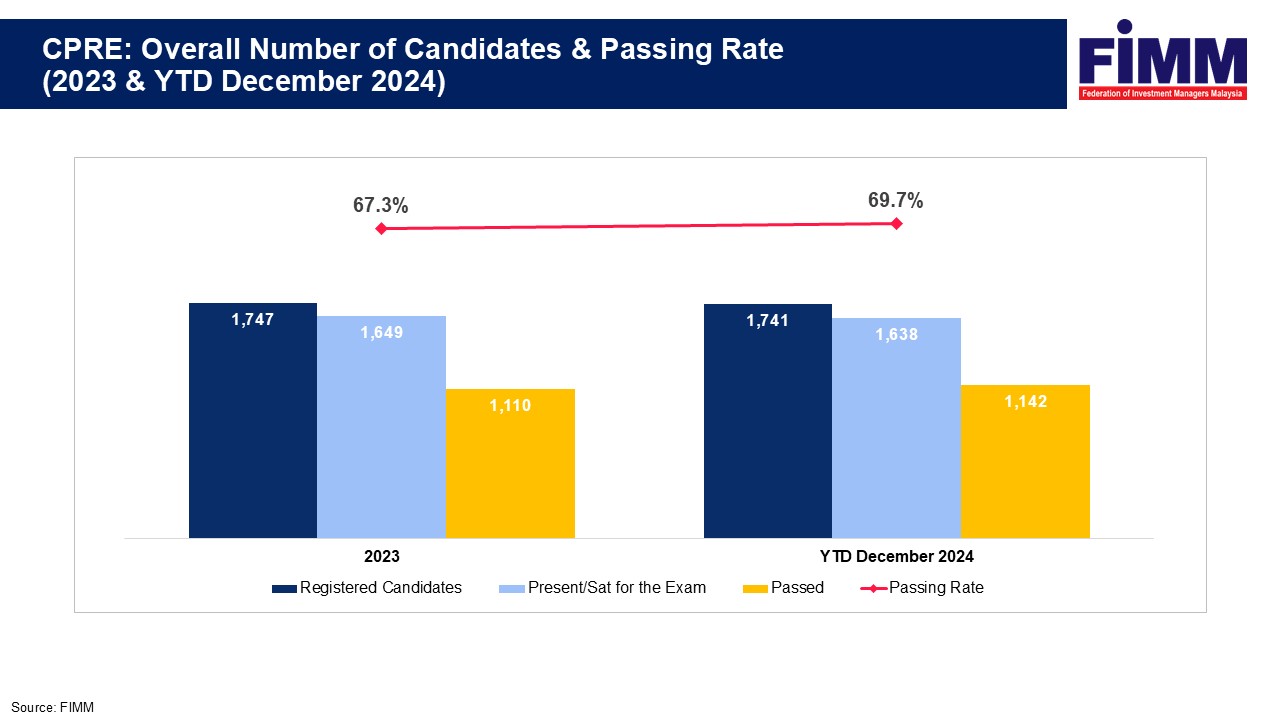
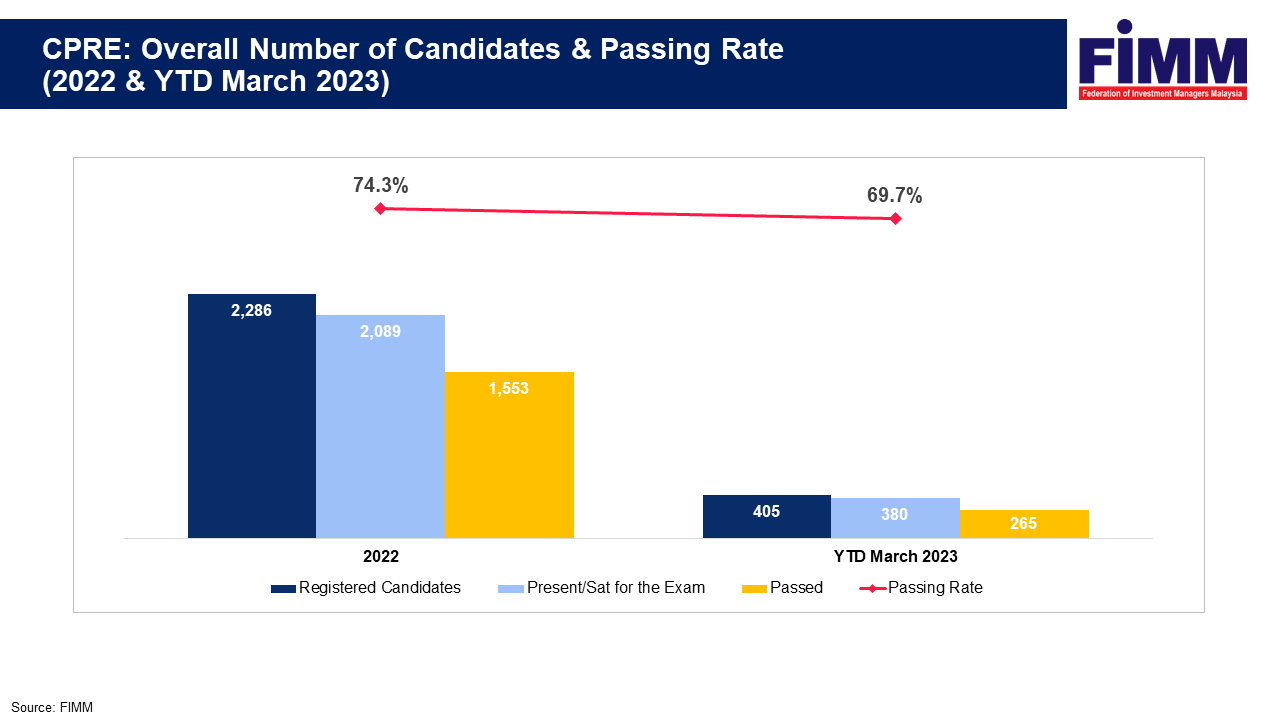
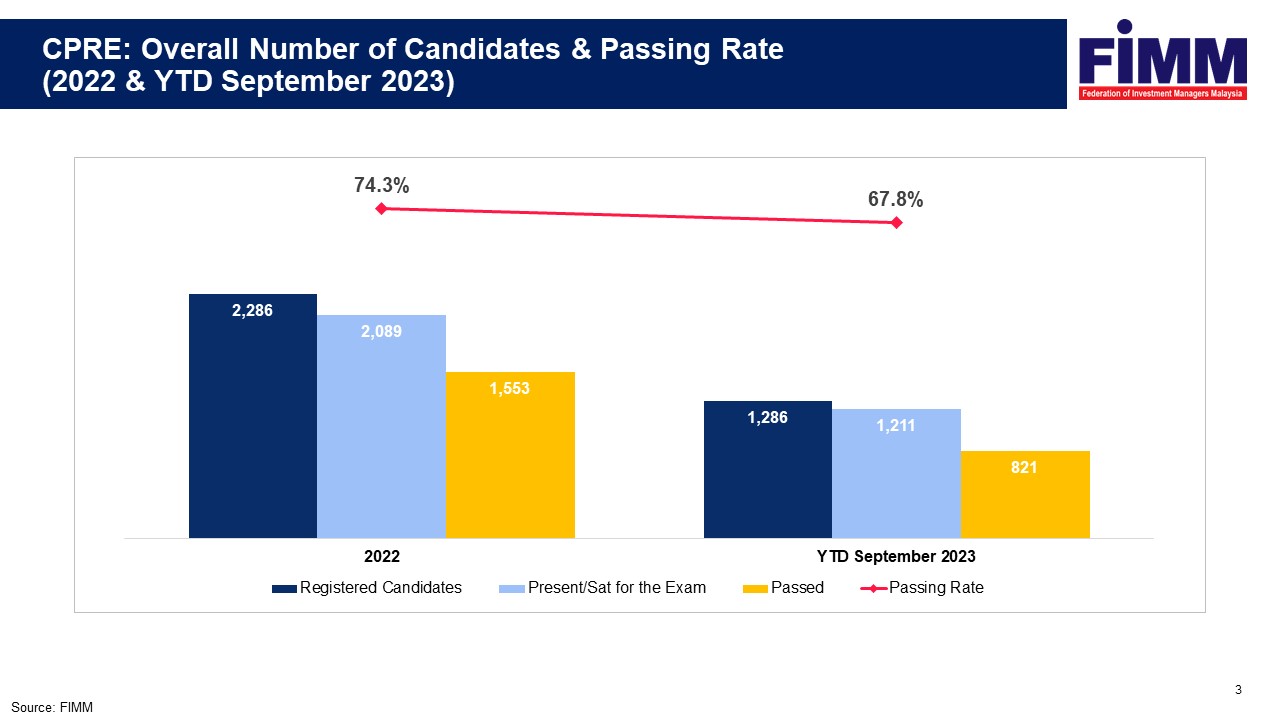
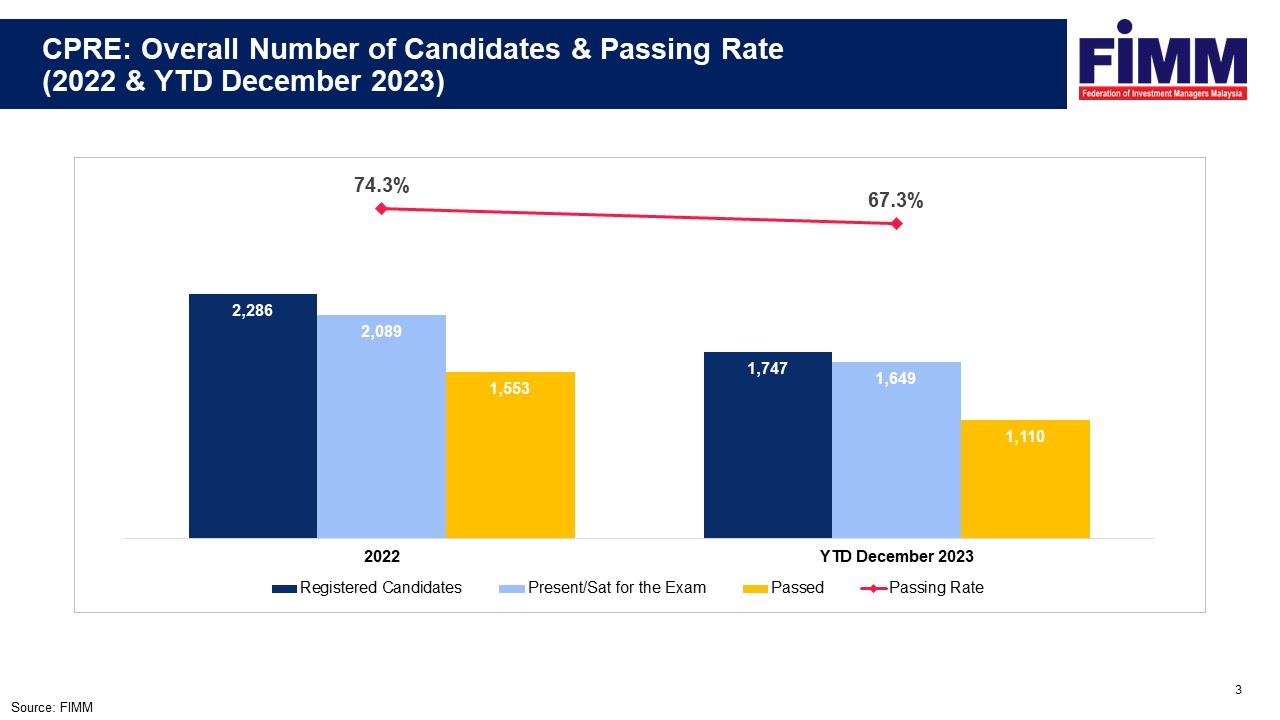
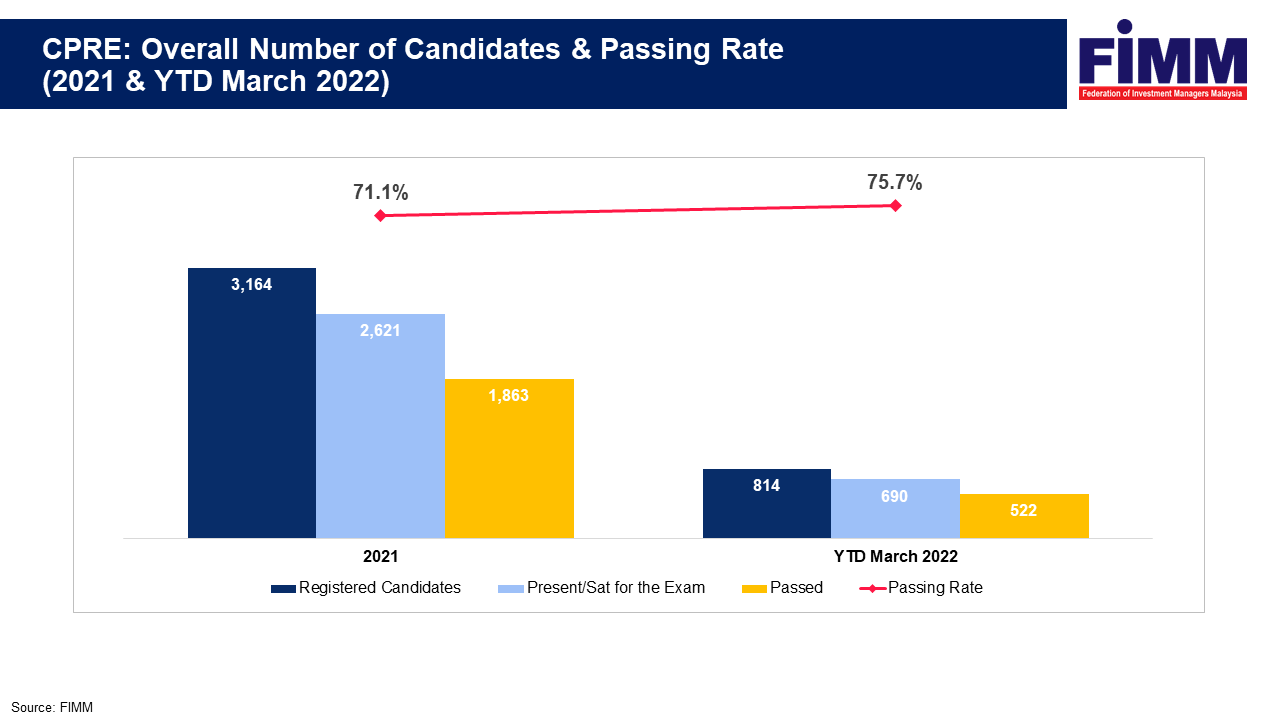
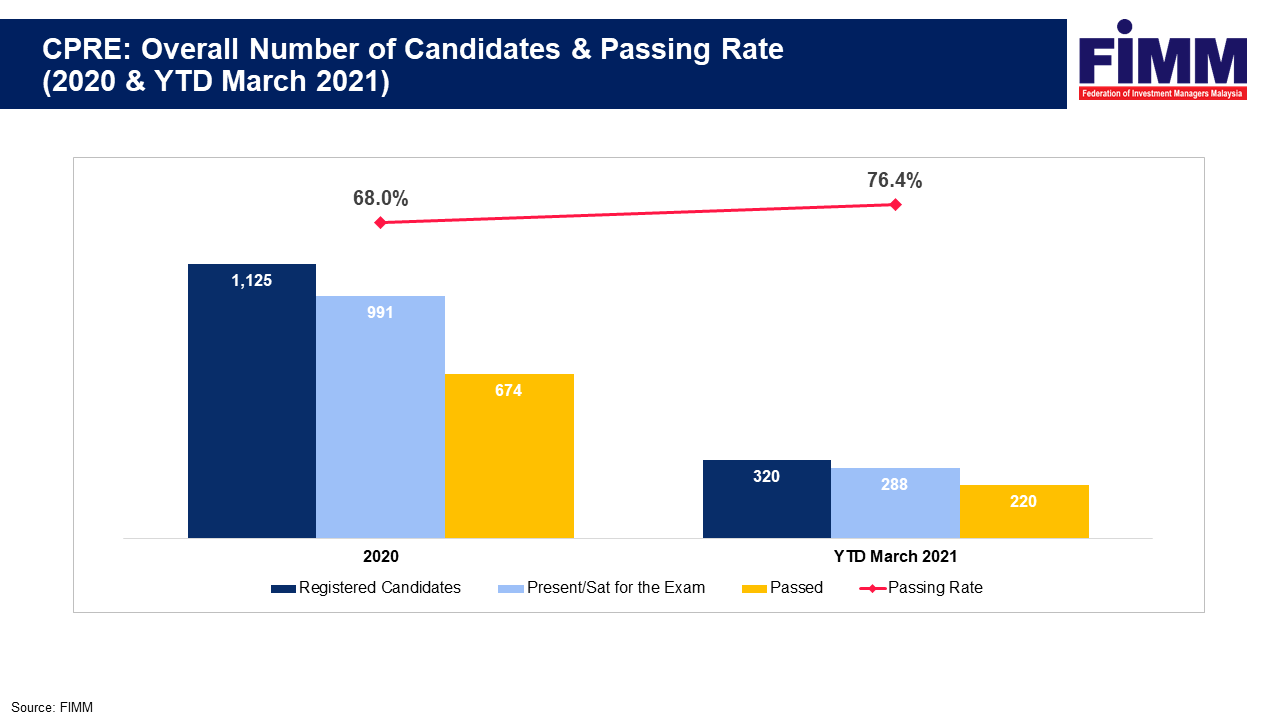
Overall Number of Candidates and Passing Rate

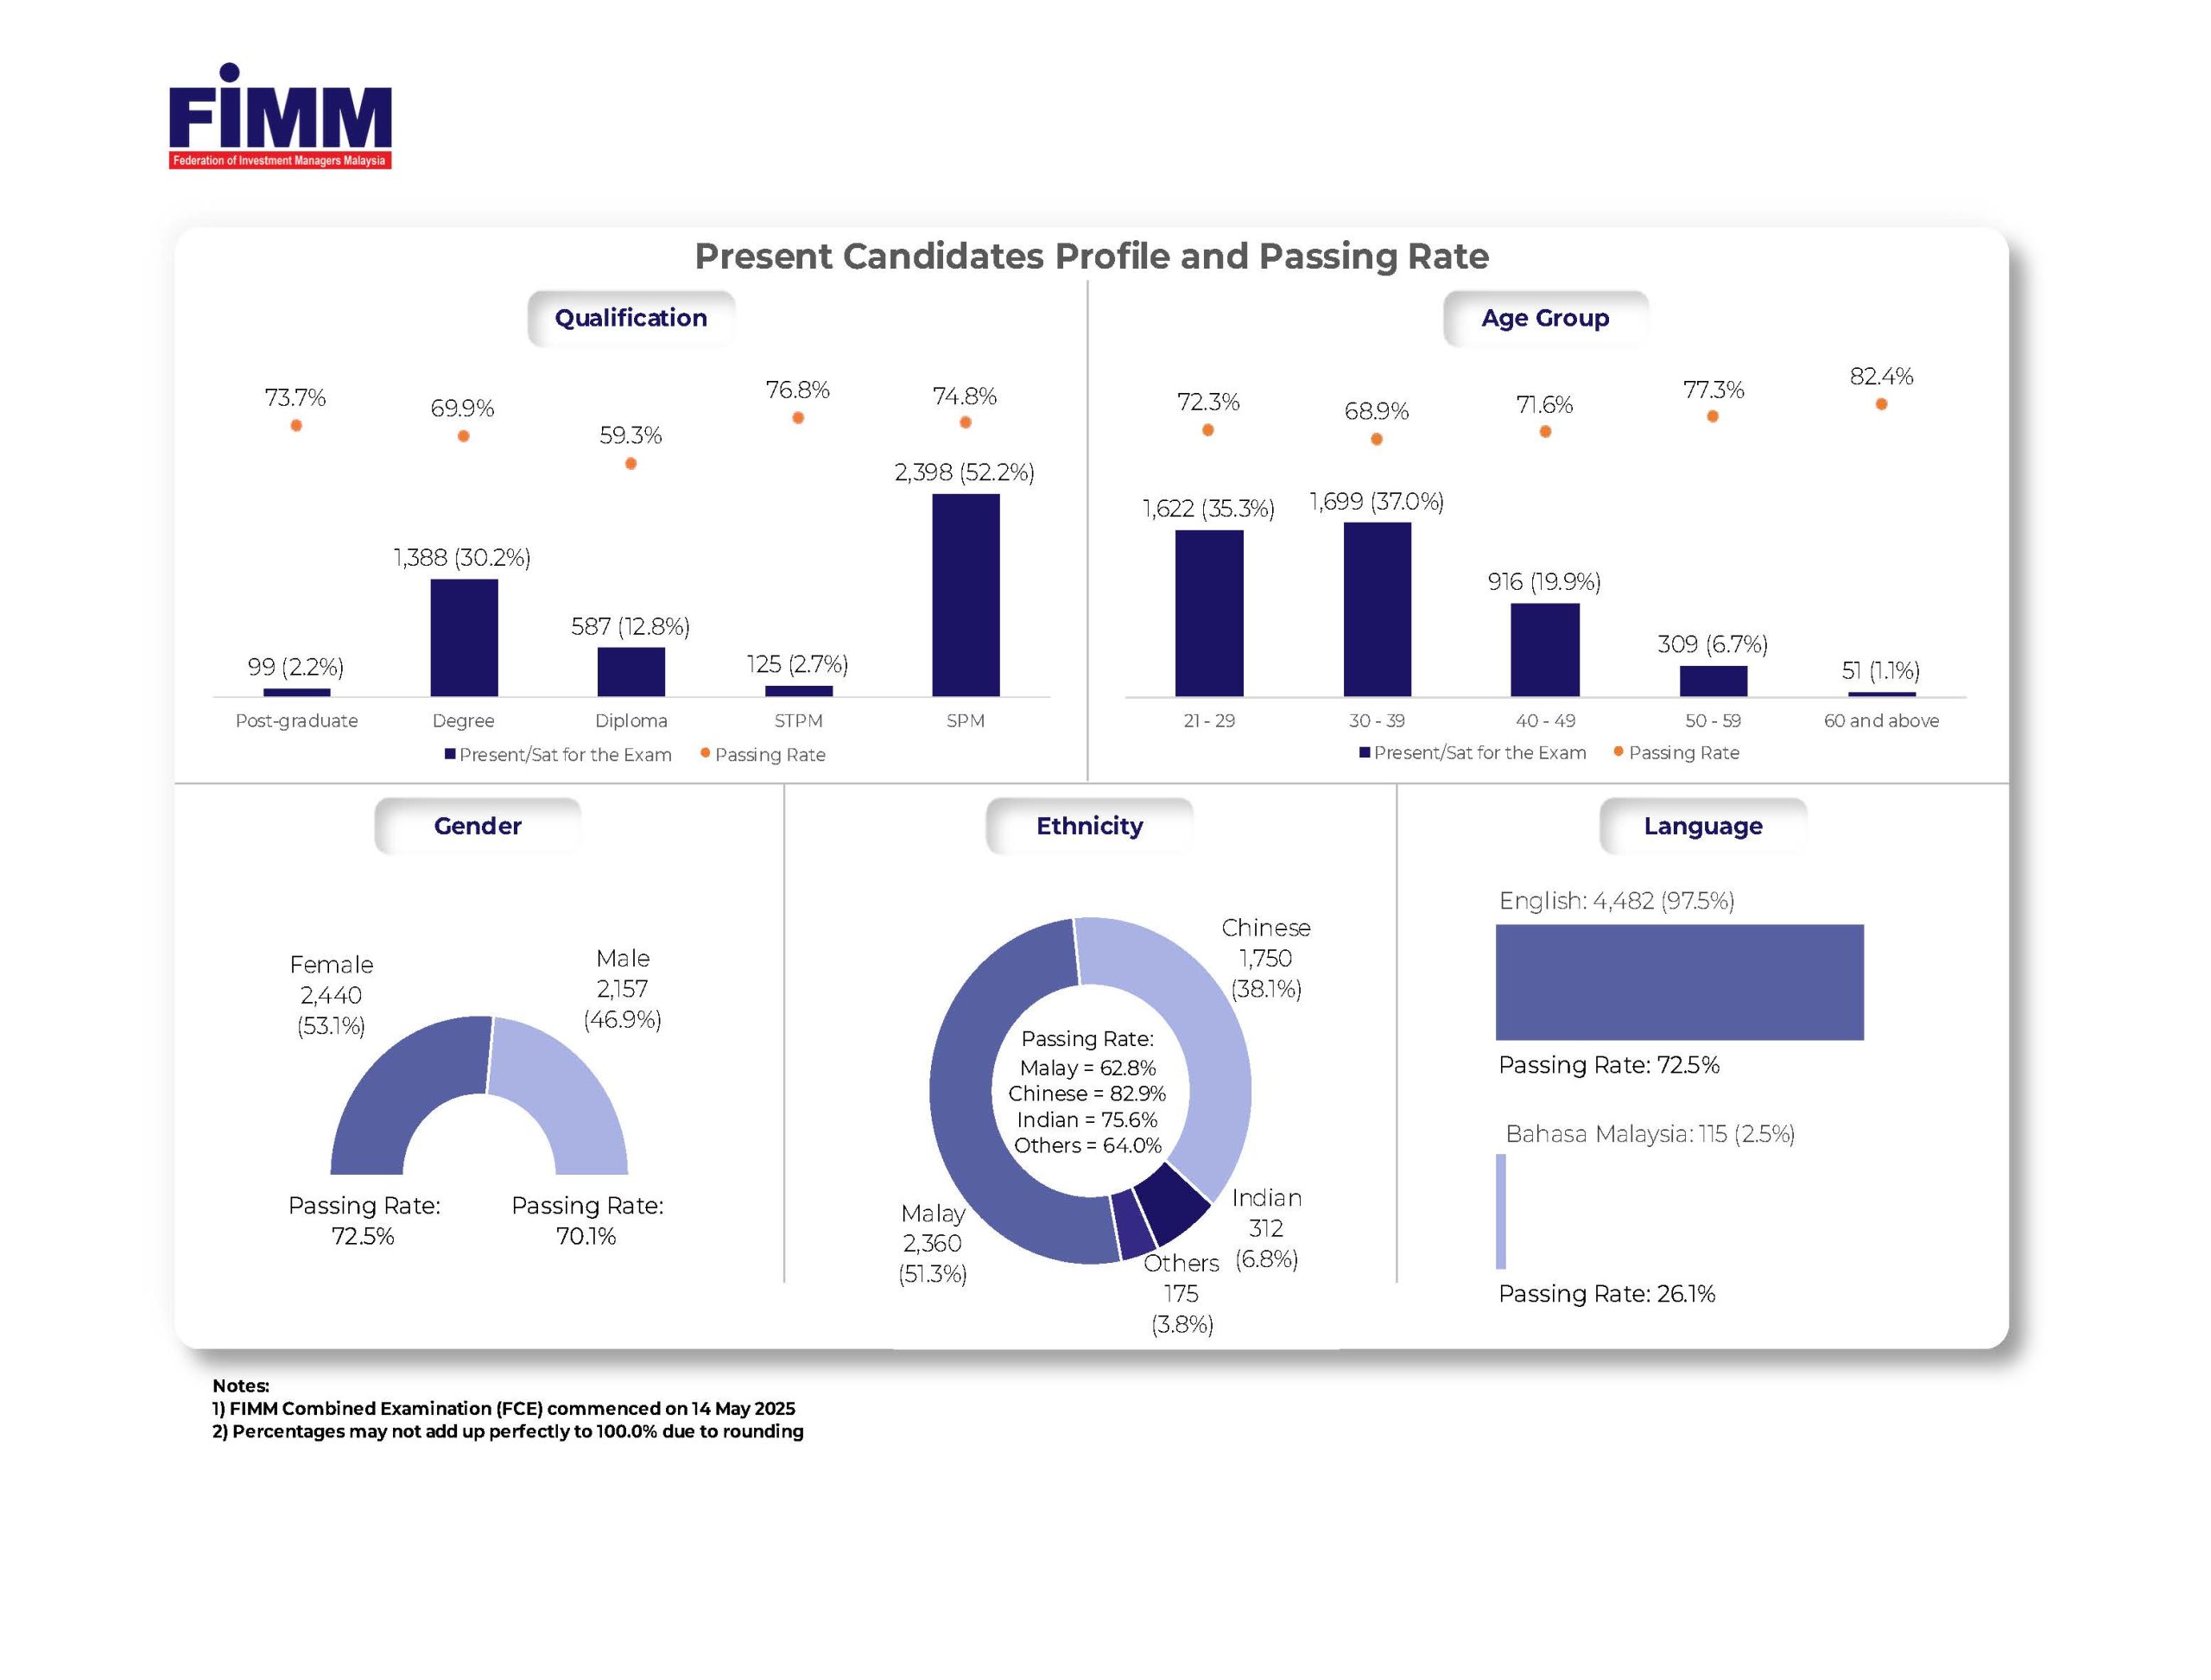
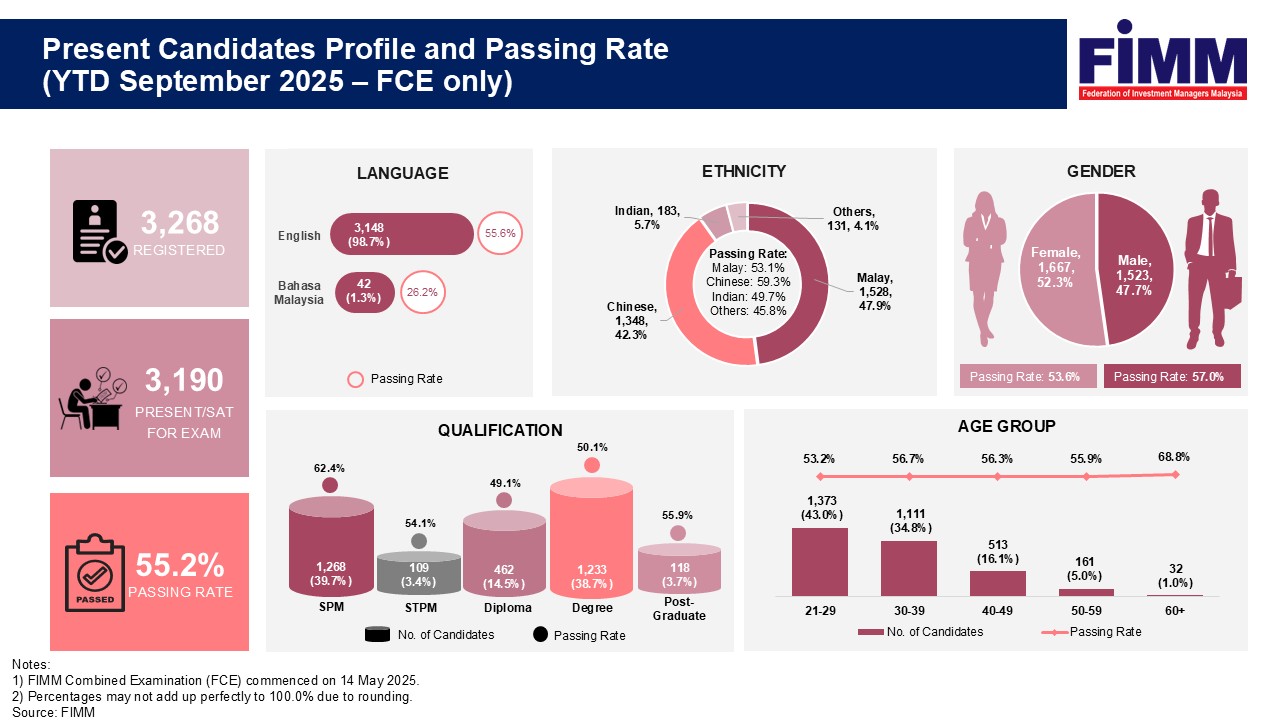
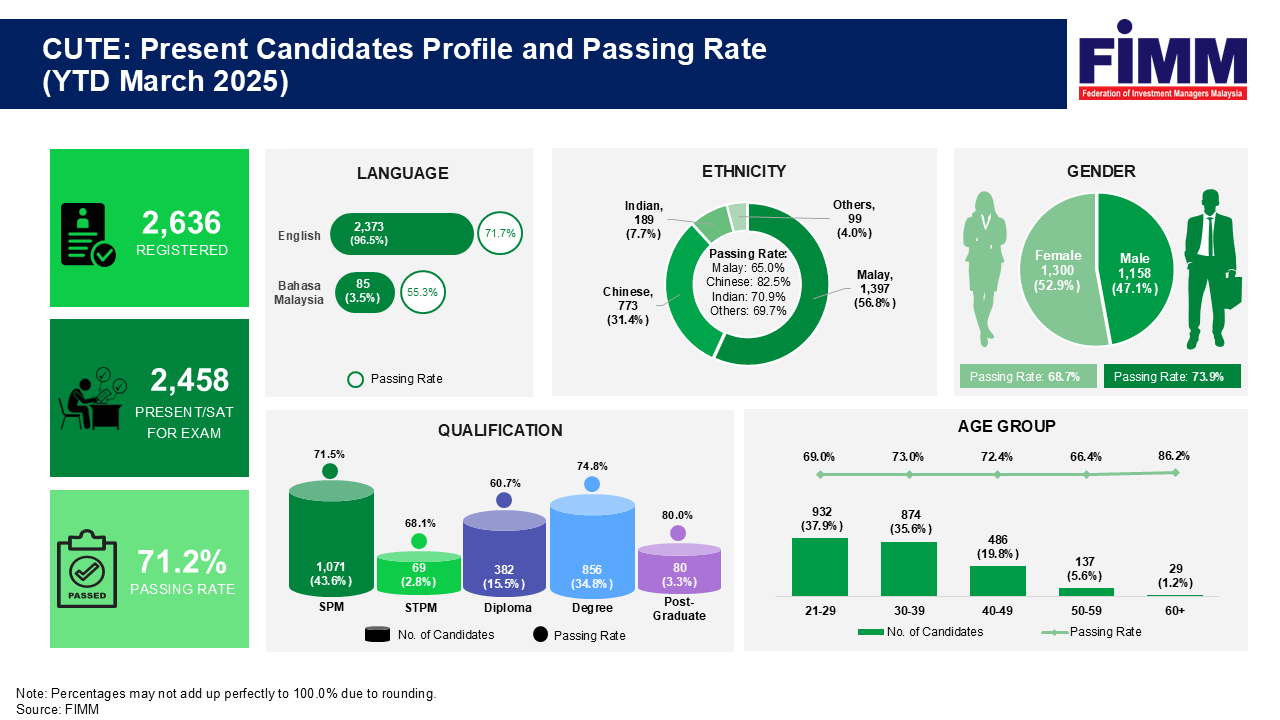
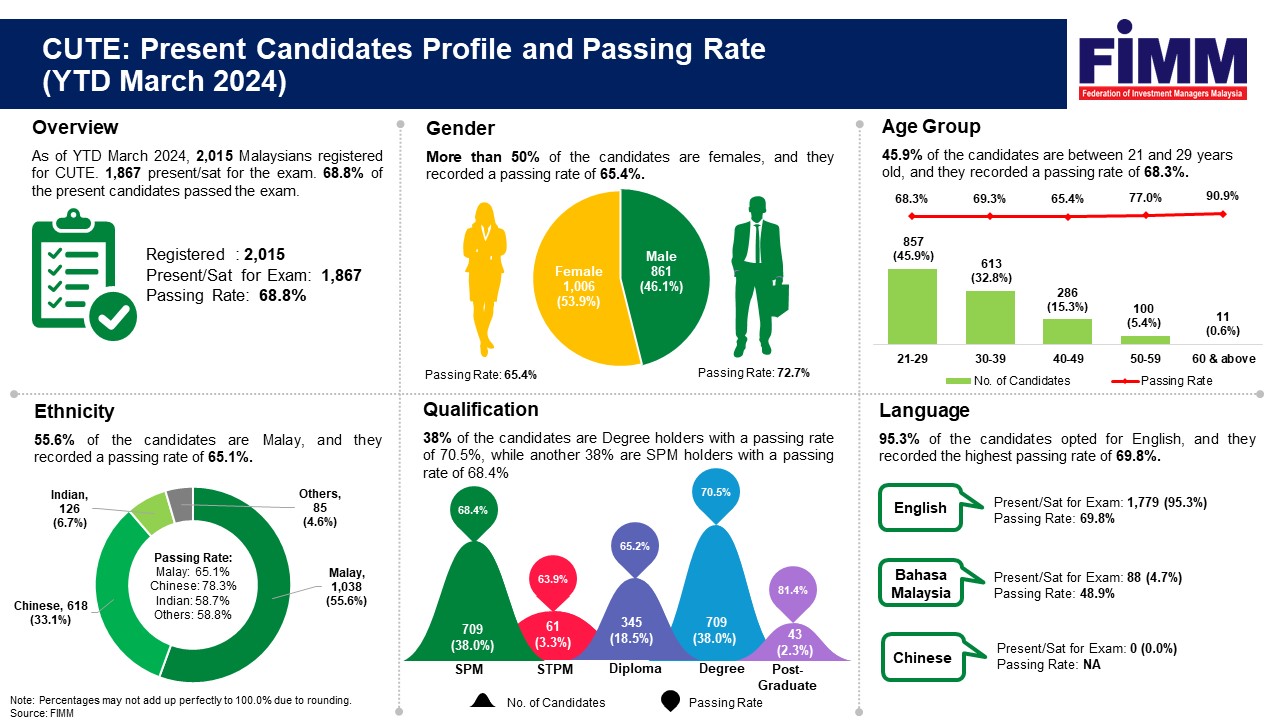
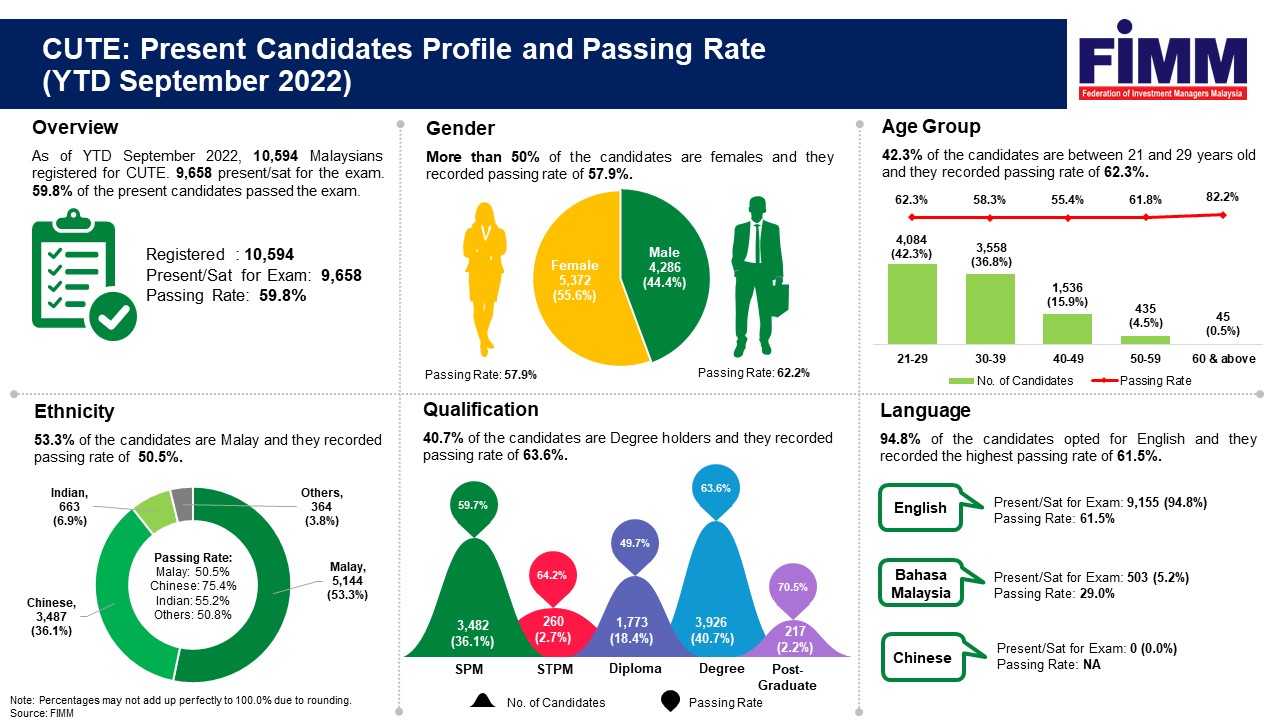
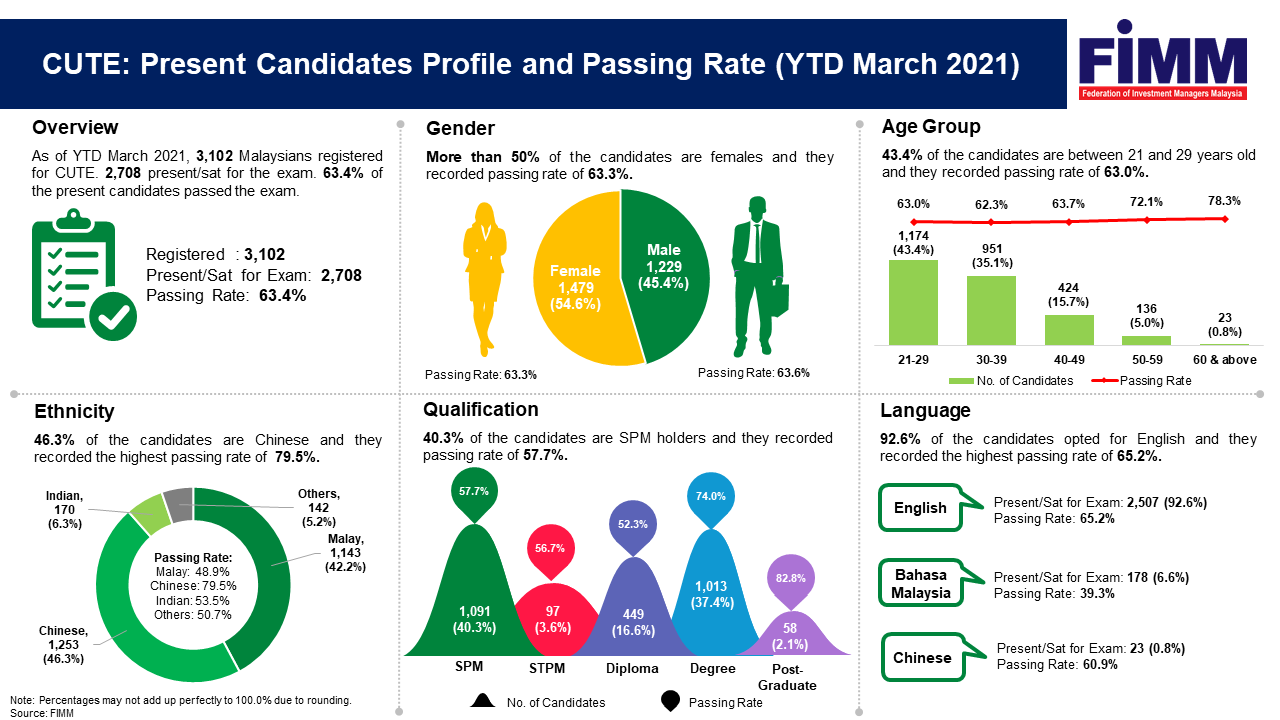
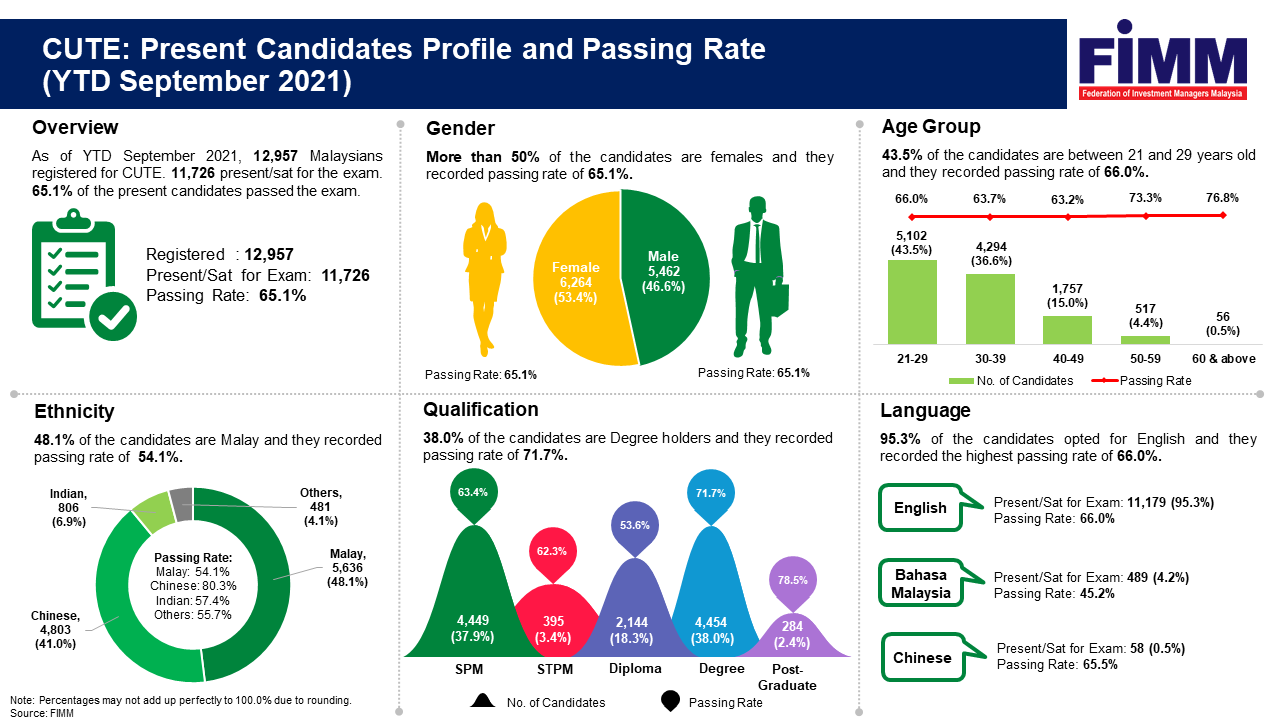
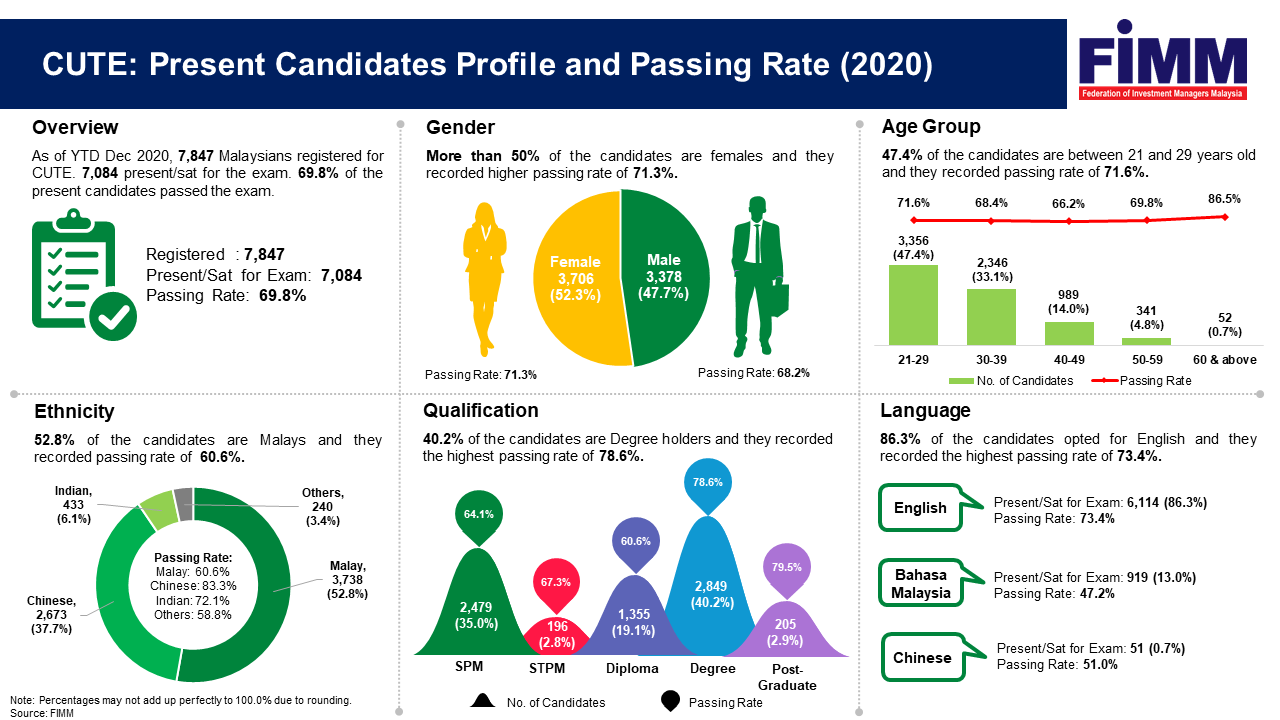
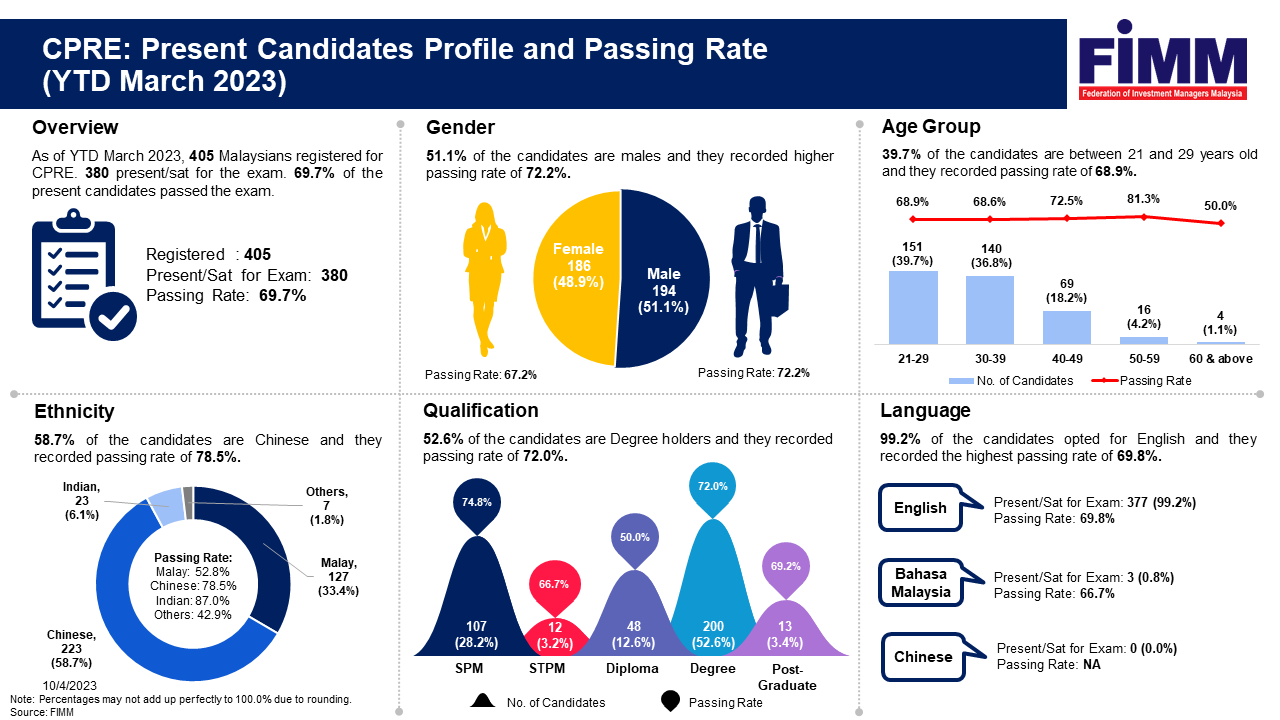
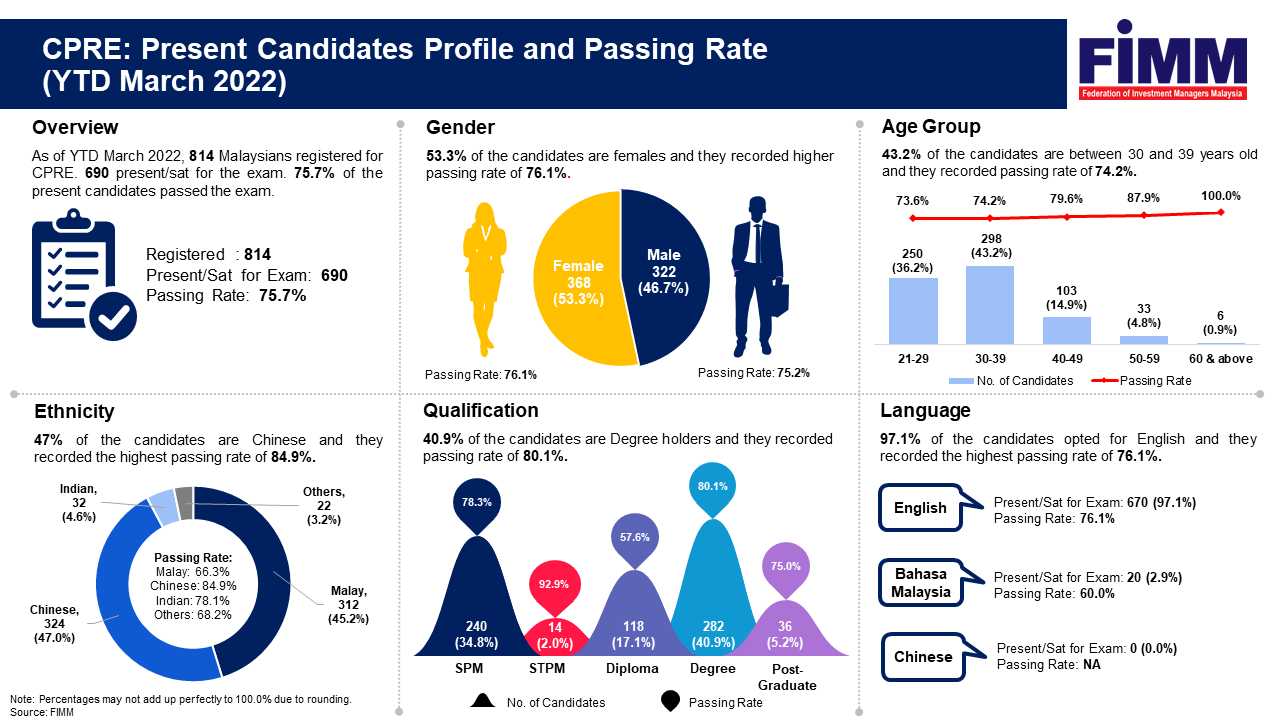
Present Candidate Profile and Passing Rate
Q2

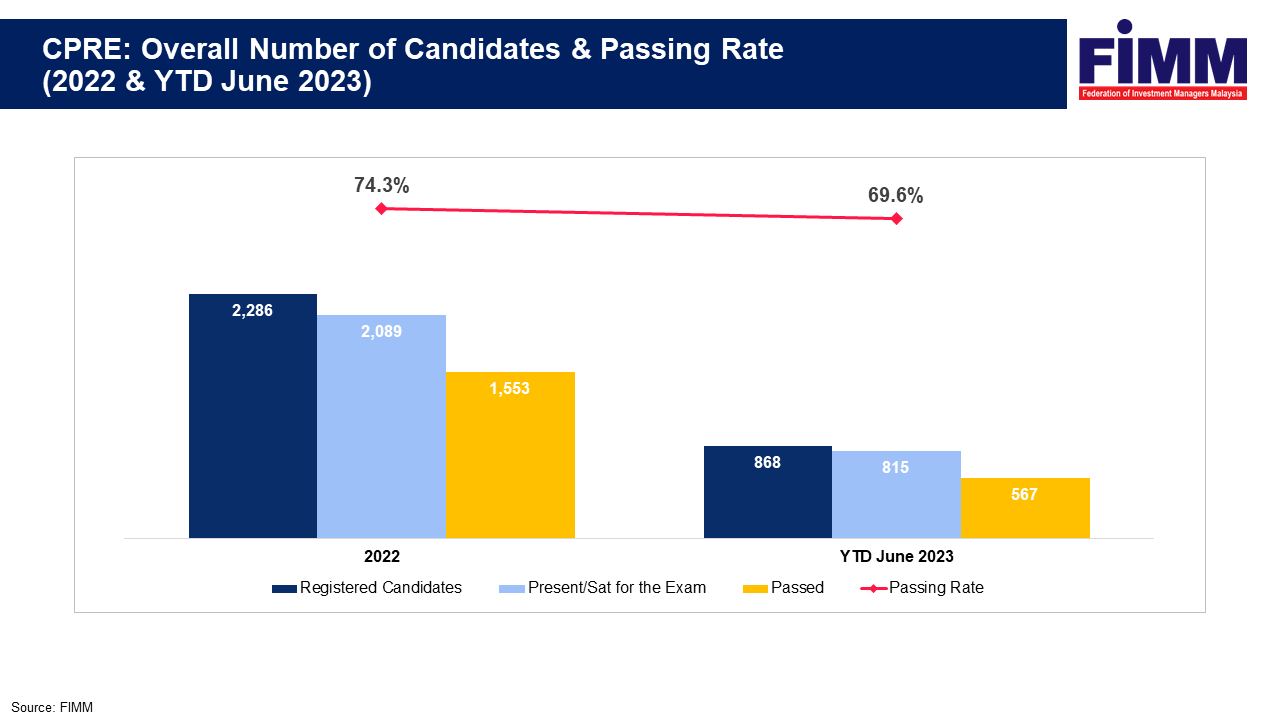
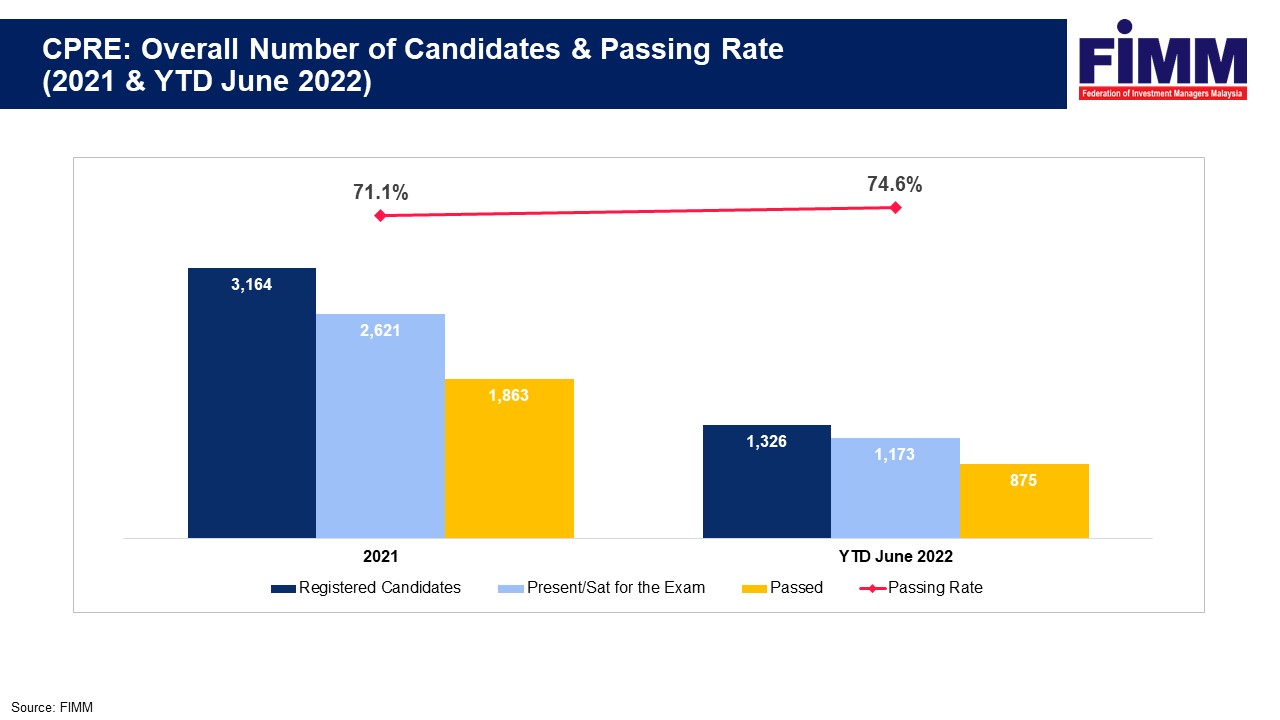
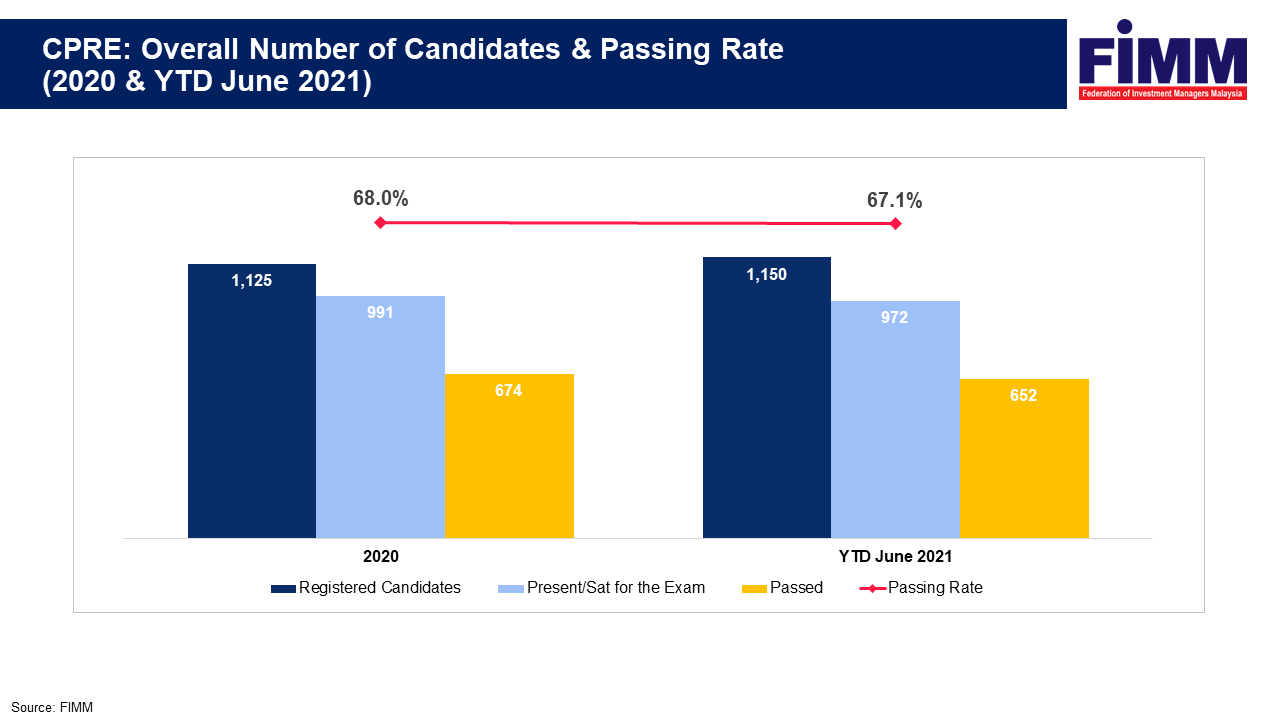
Overall Number of Candidates and Passing Rate
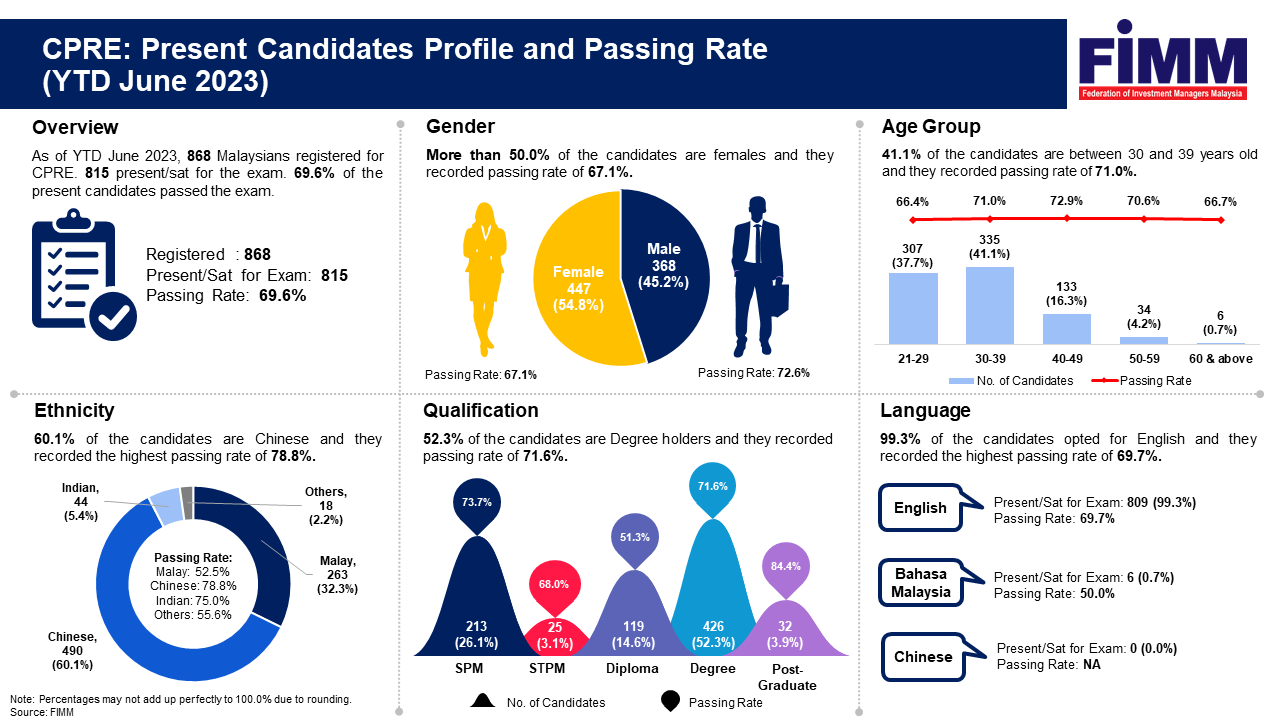
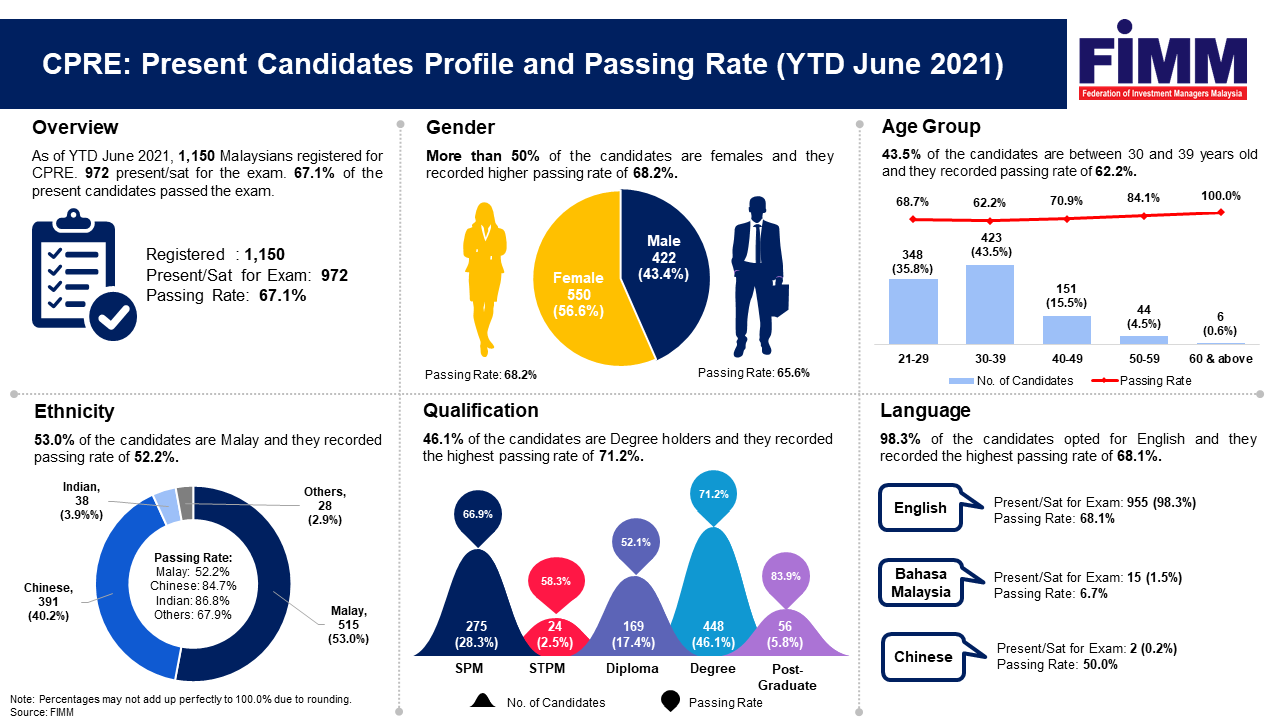
Present Candidate Profile and Passing Rate
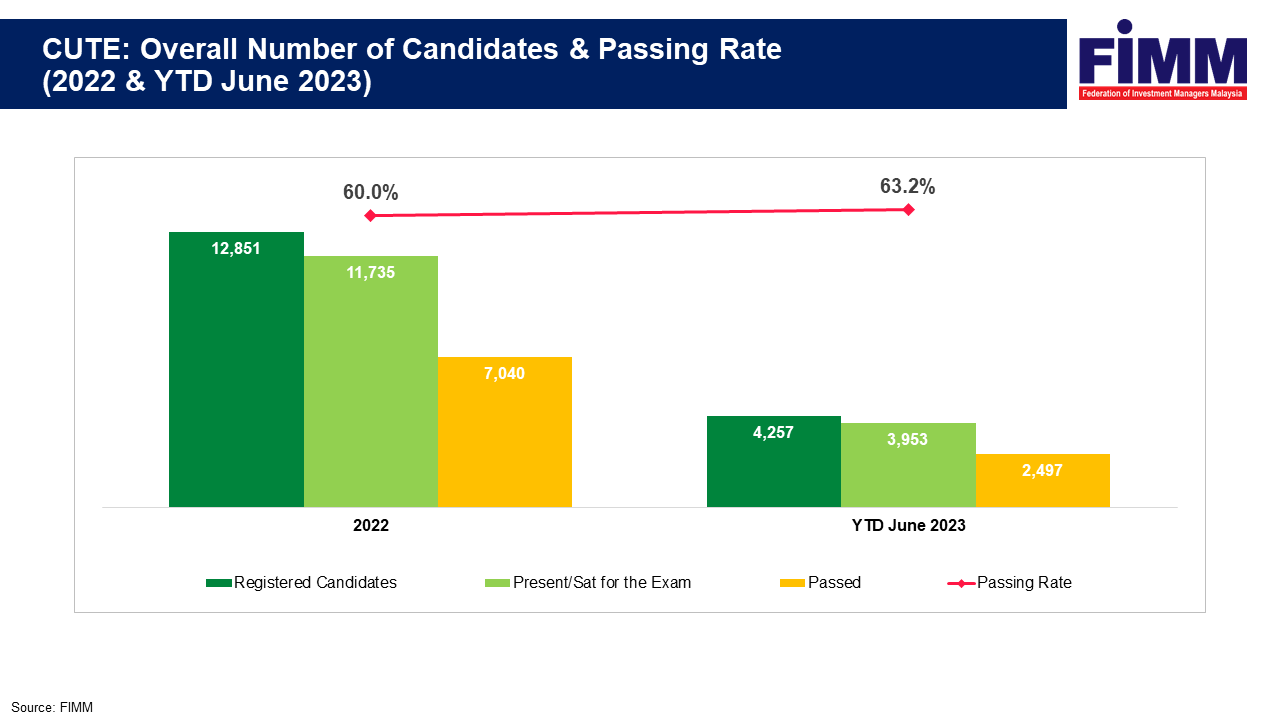
Q2 (May-June)

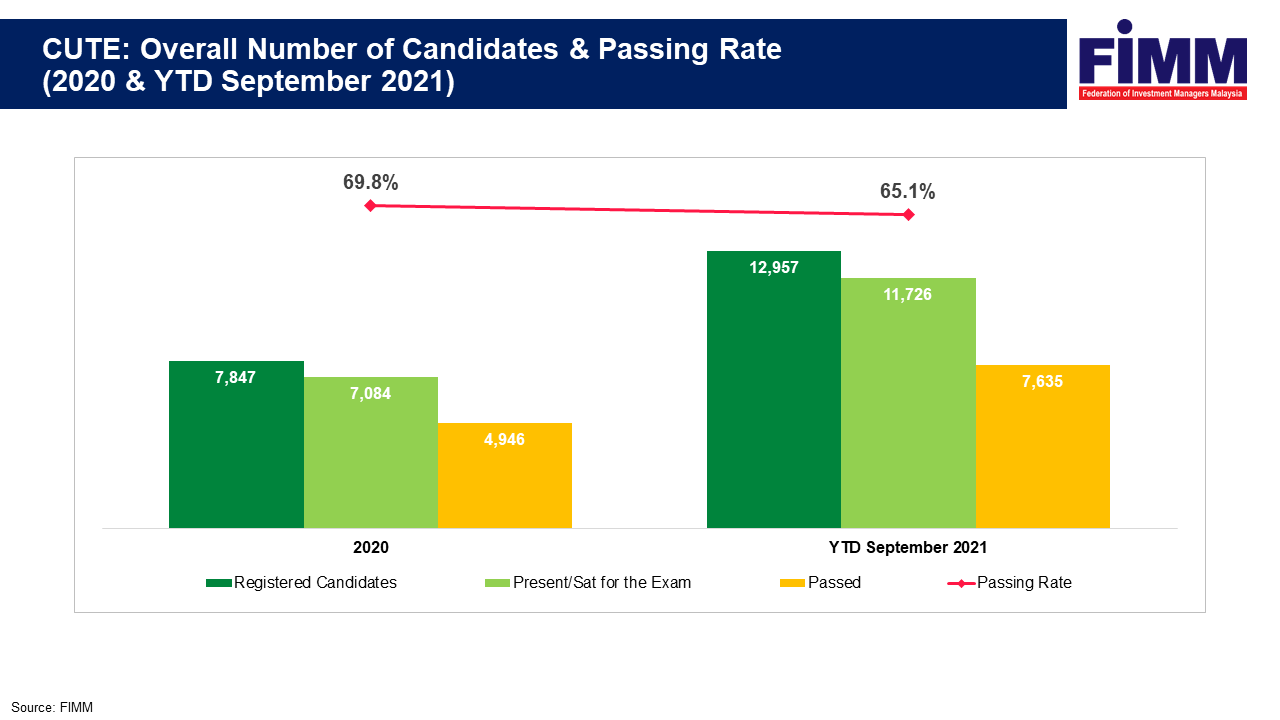
Overall Number of Candidates and Passing Rate

Present Candidate Profile and Passing Rate
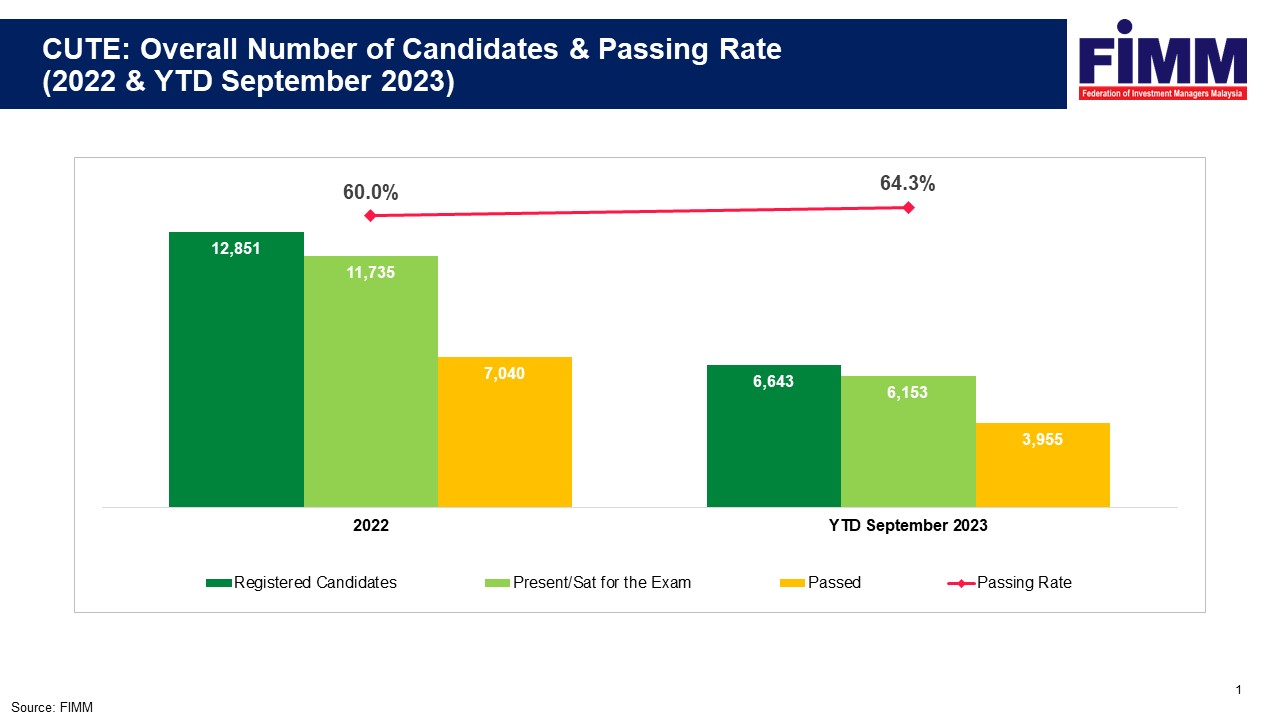
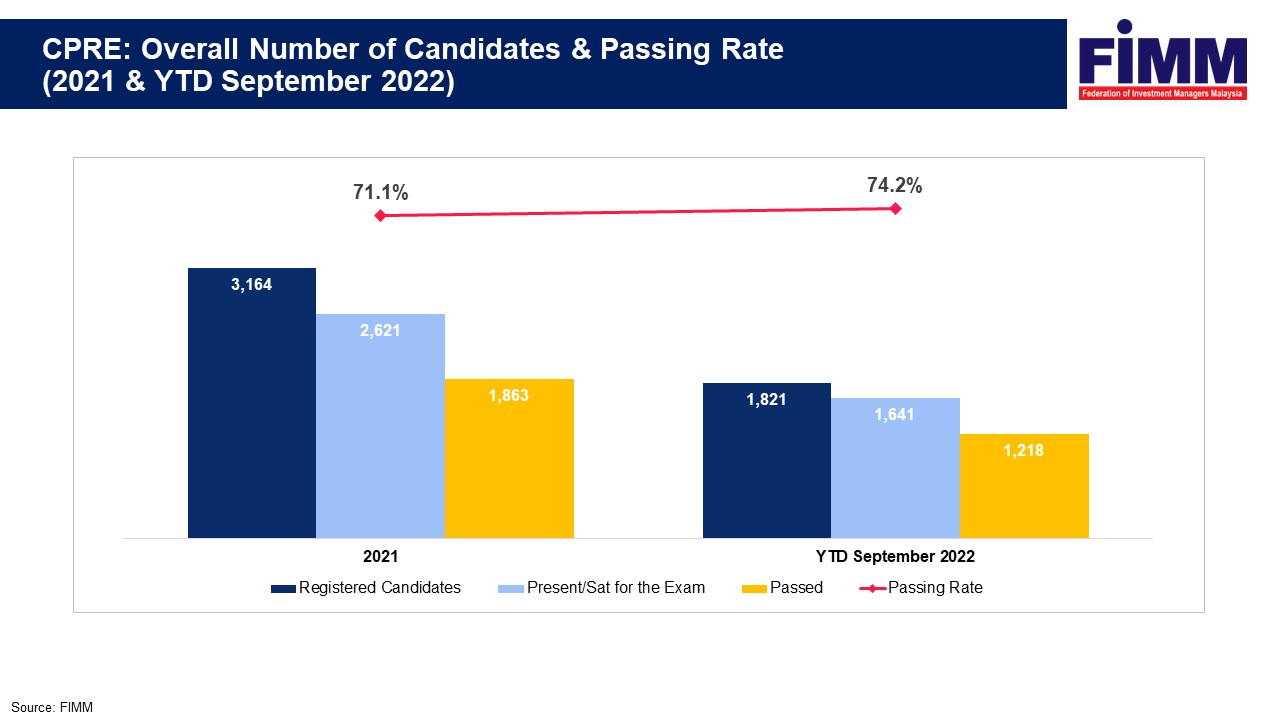
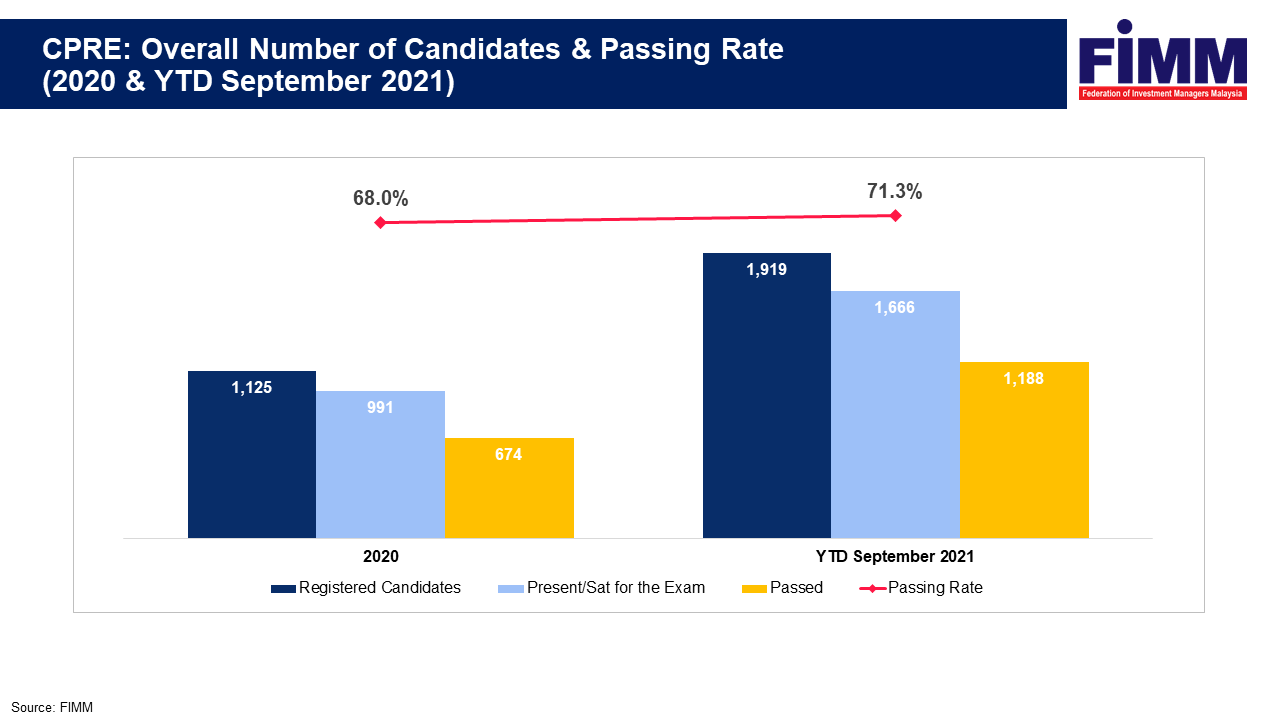
Q3
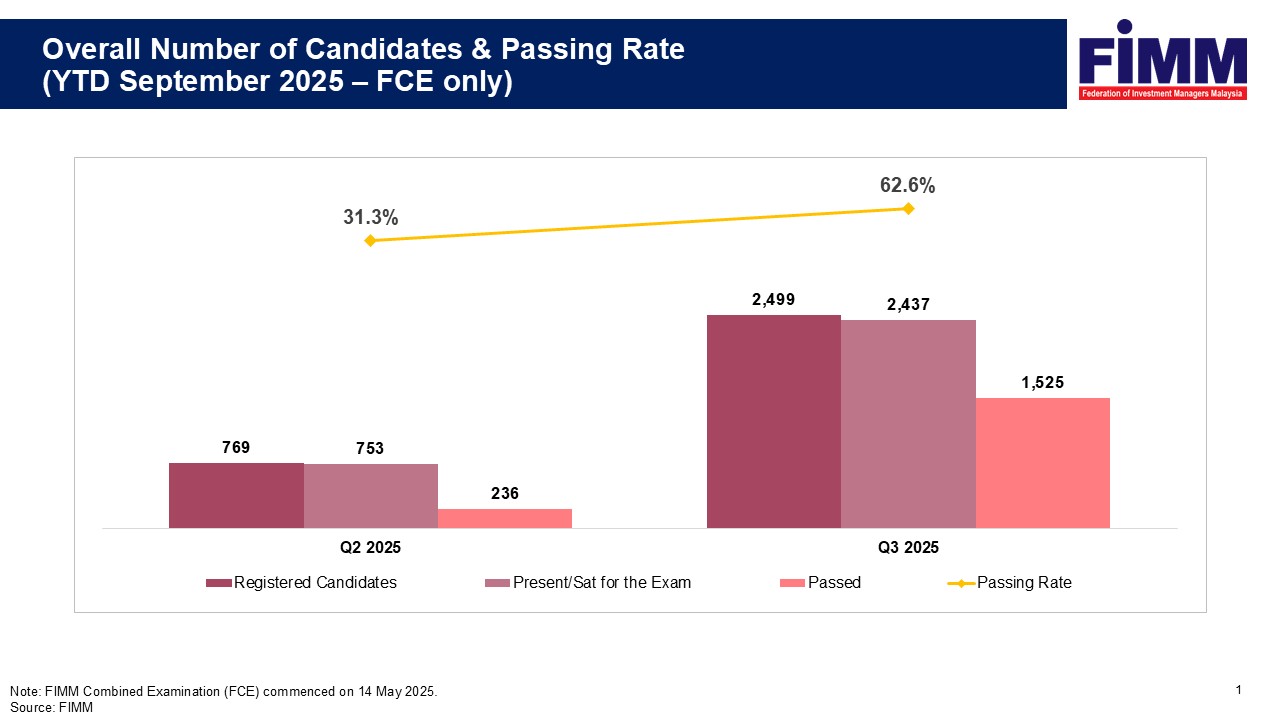
Overall Number of Candidates and Passing Rate
Present Candidate Profile and Passing Rate
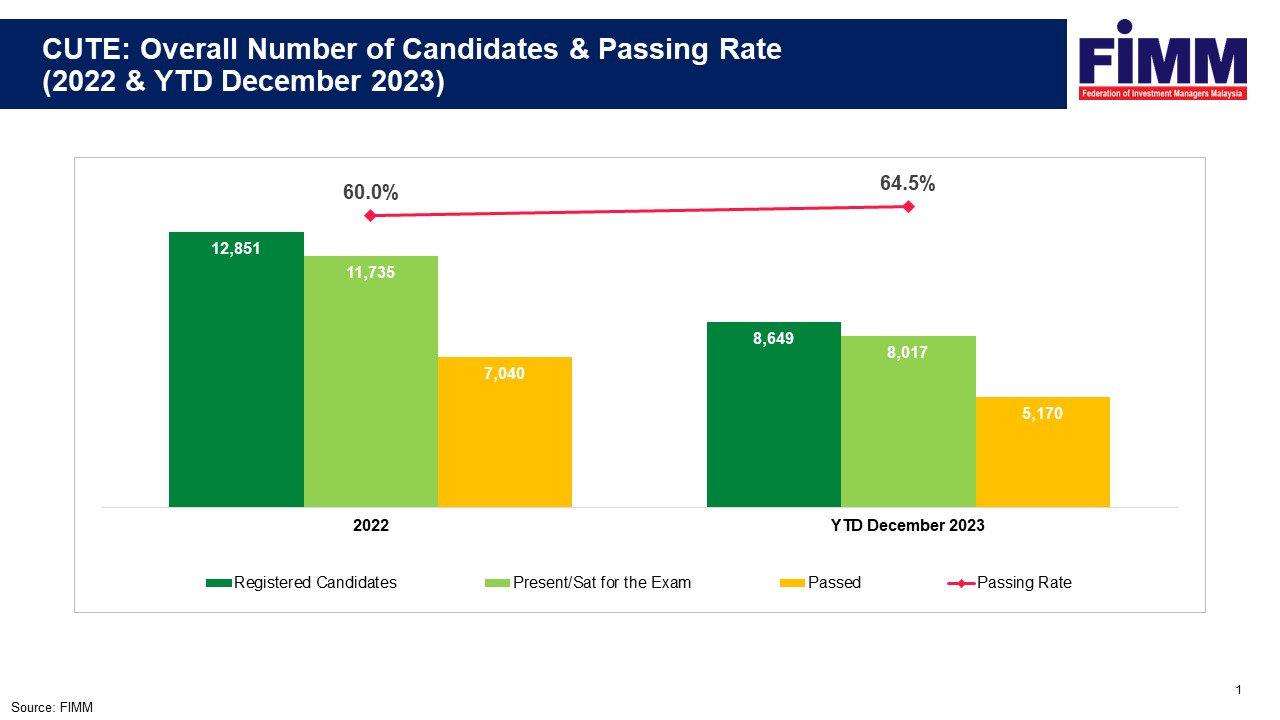
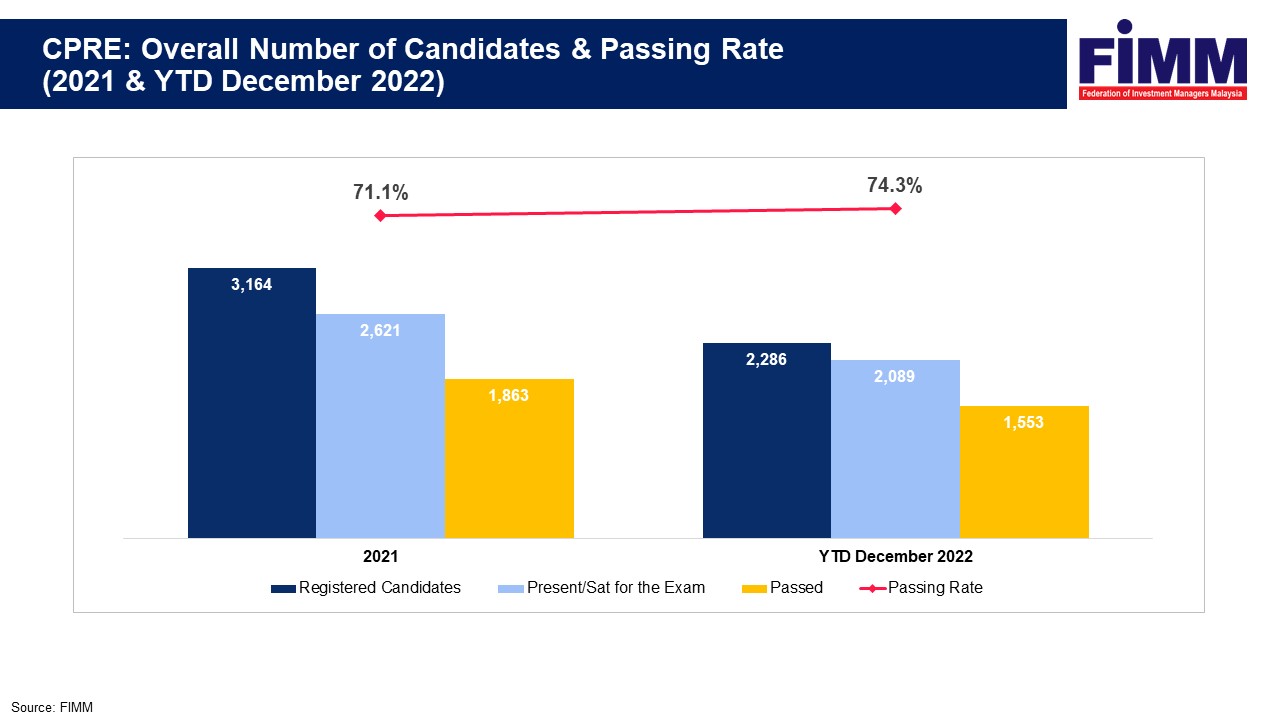
Q4
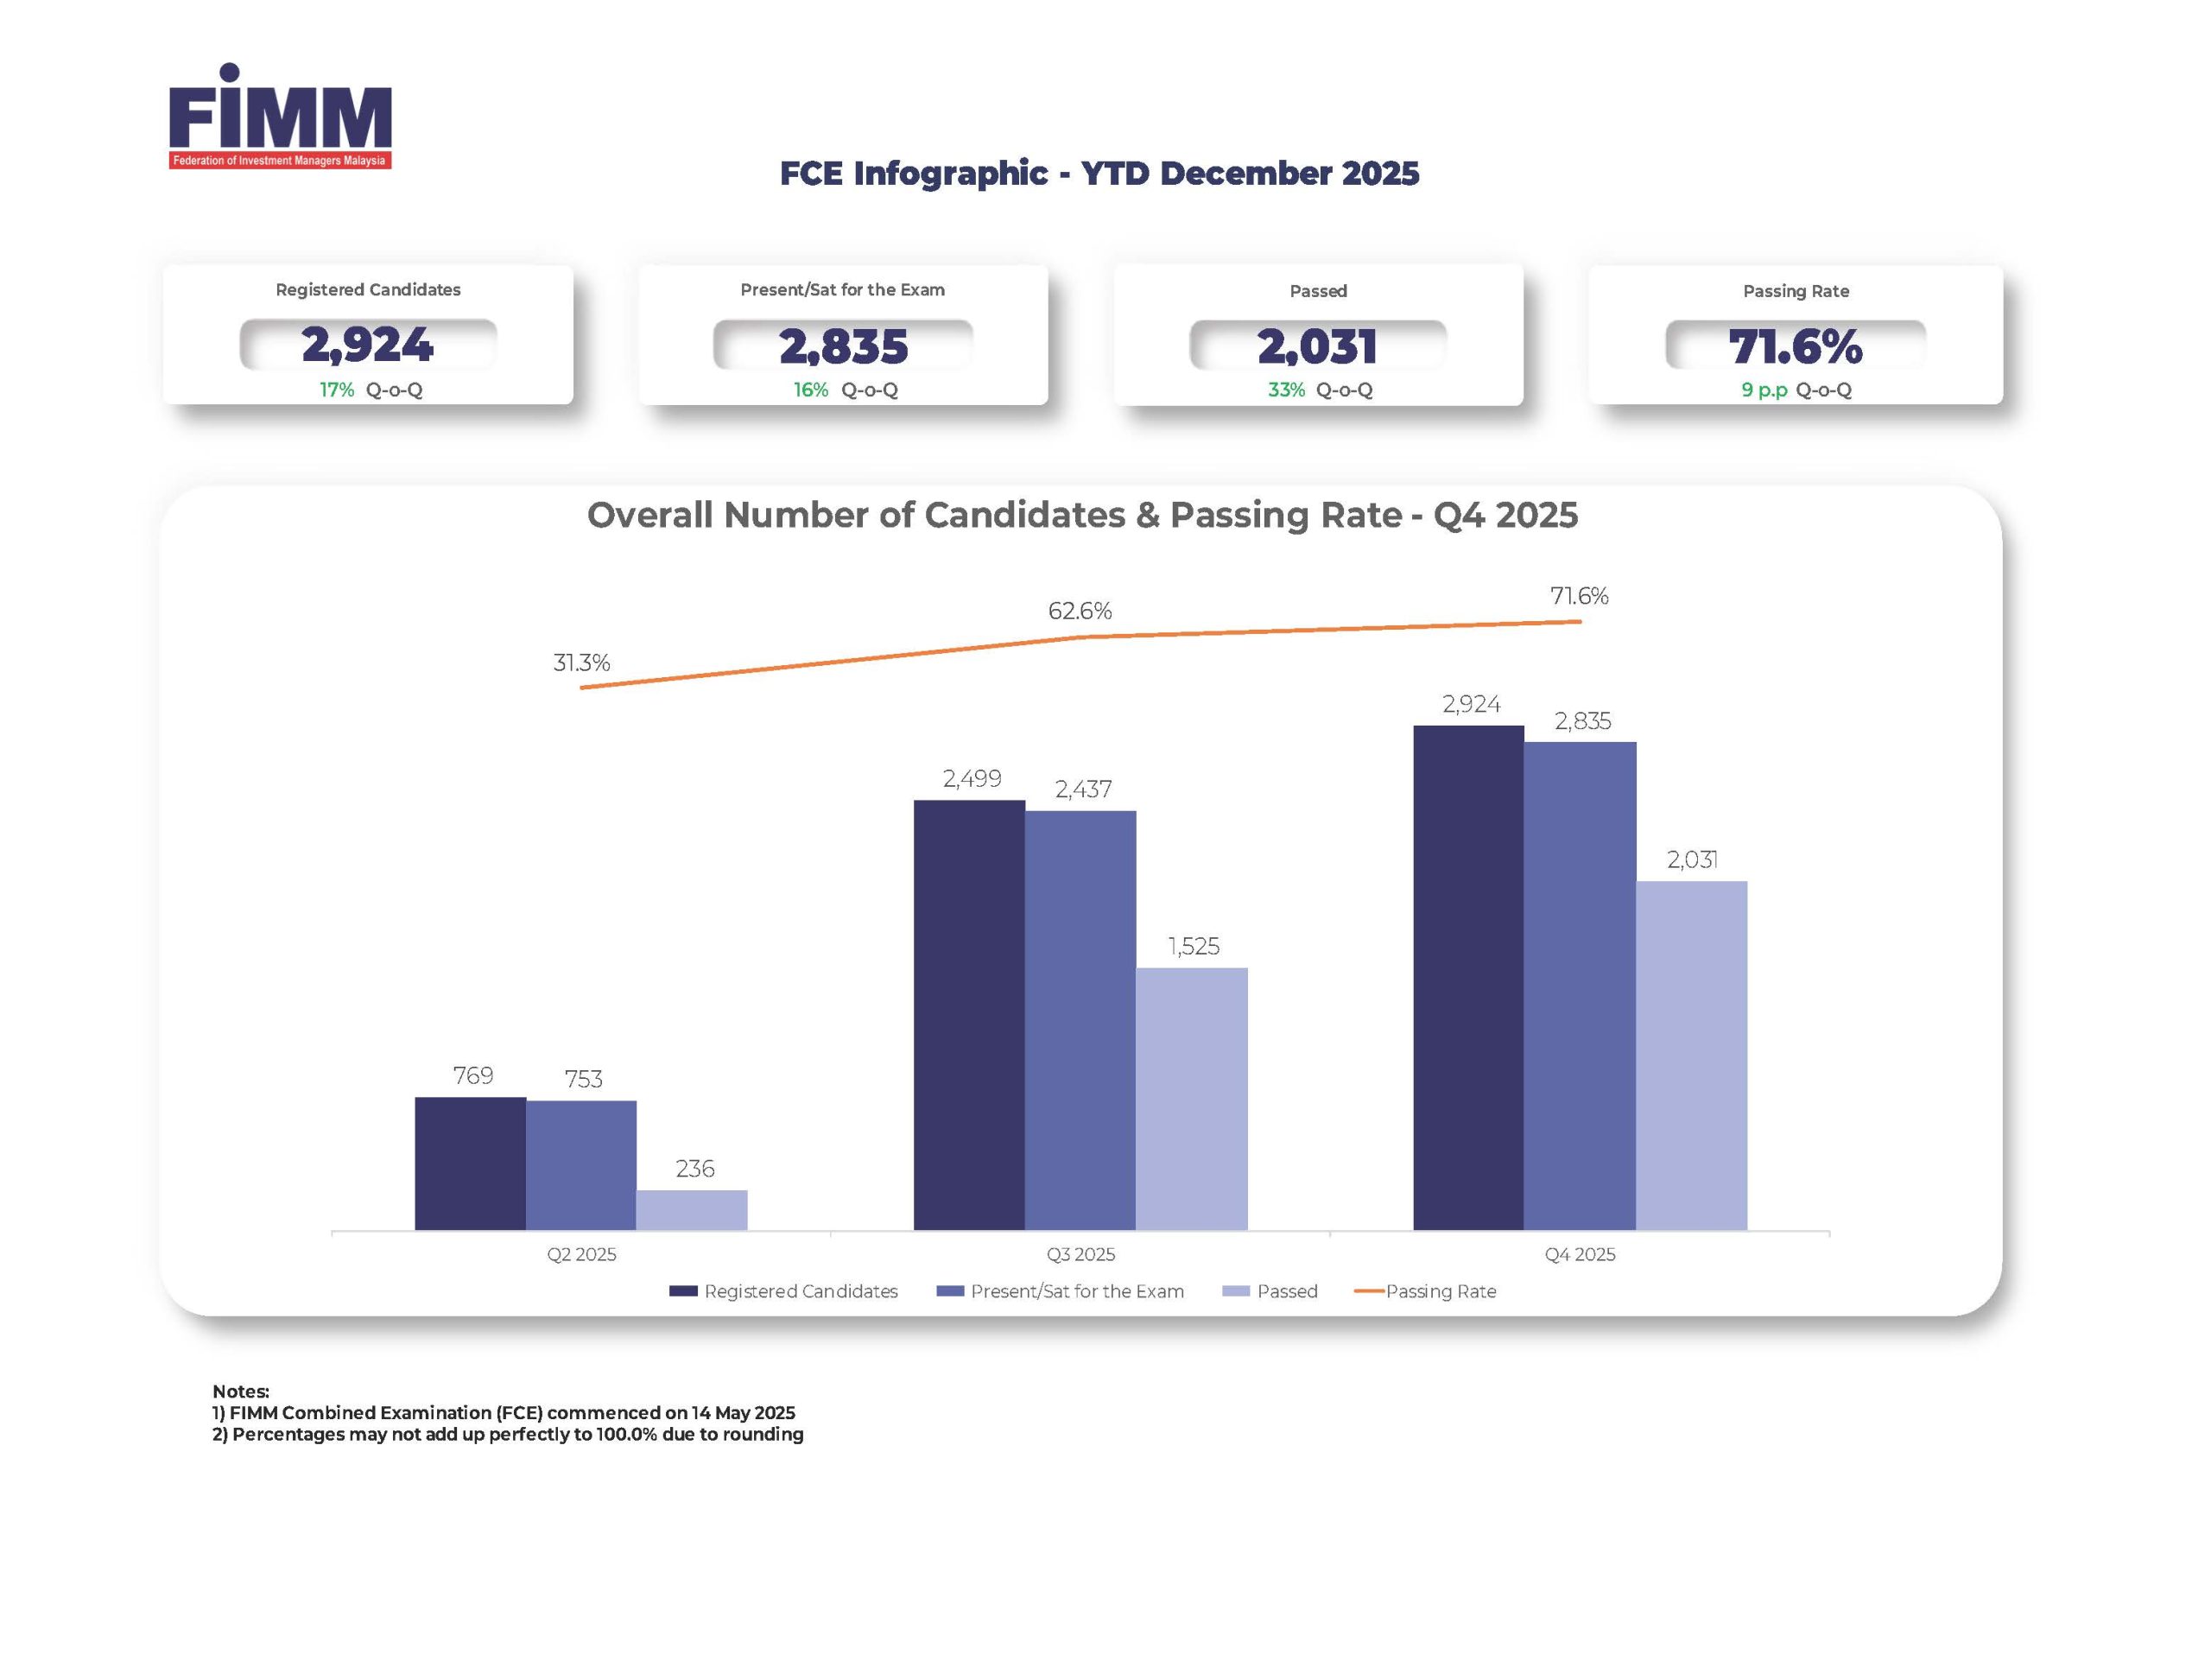
Overall Number of Candidates and Passing Rate
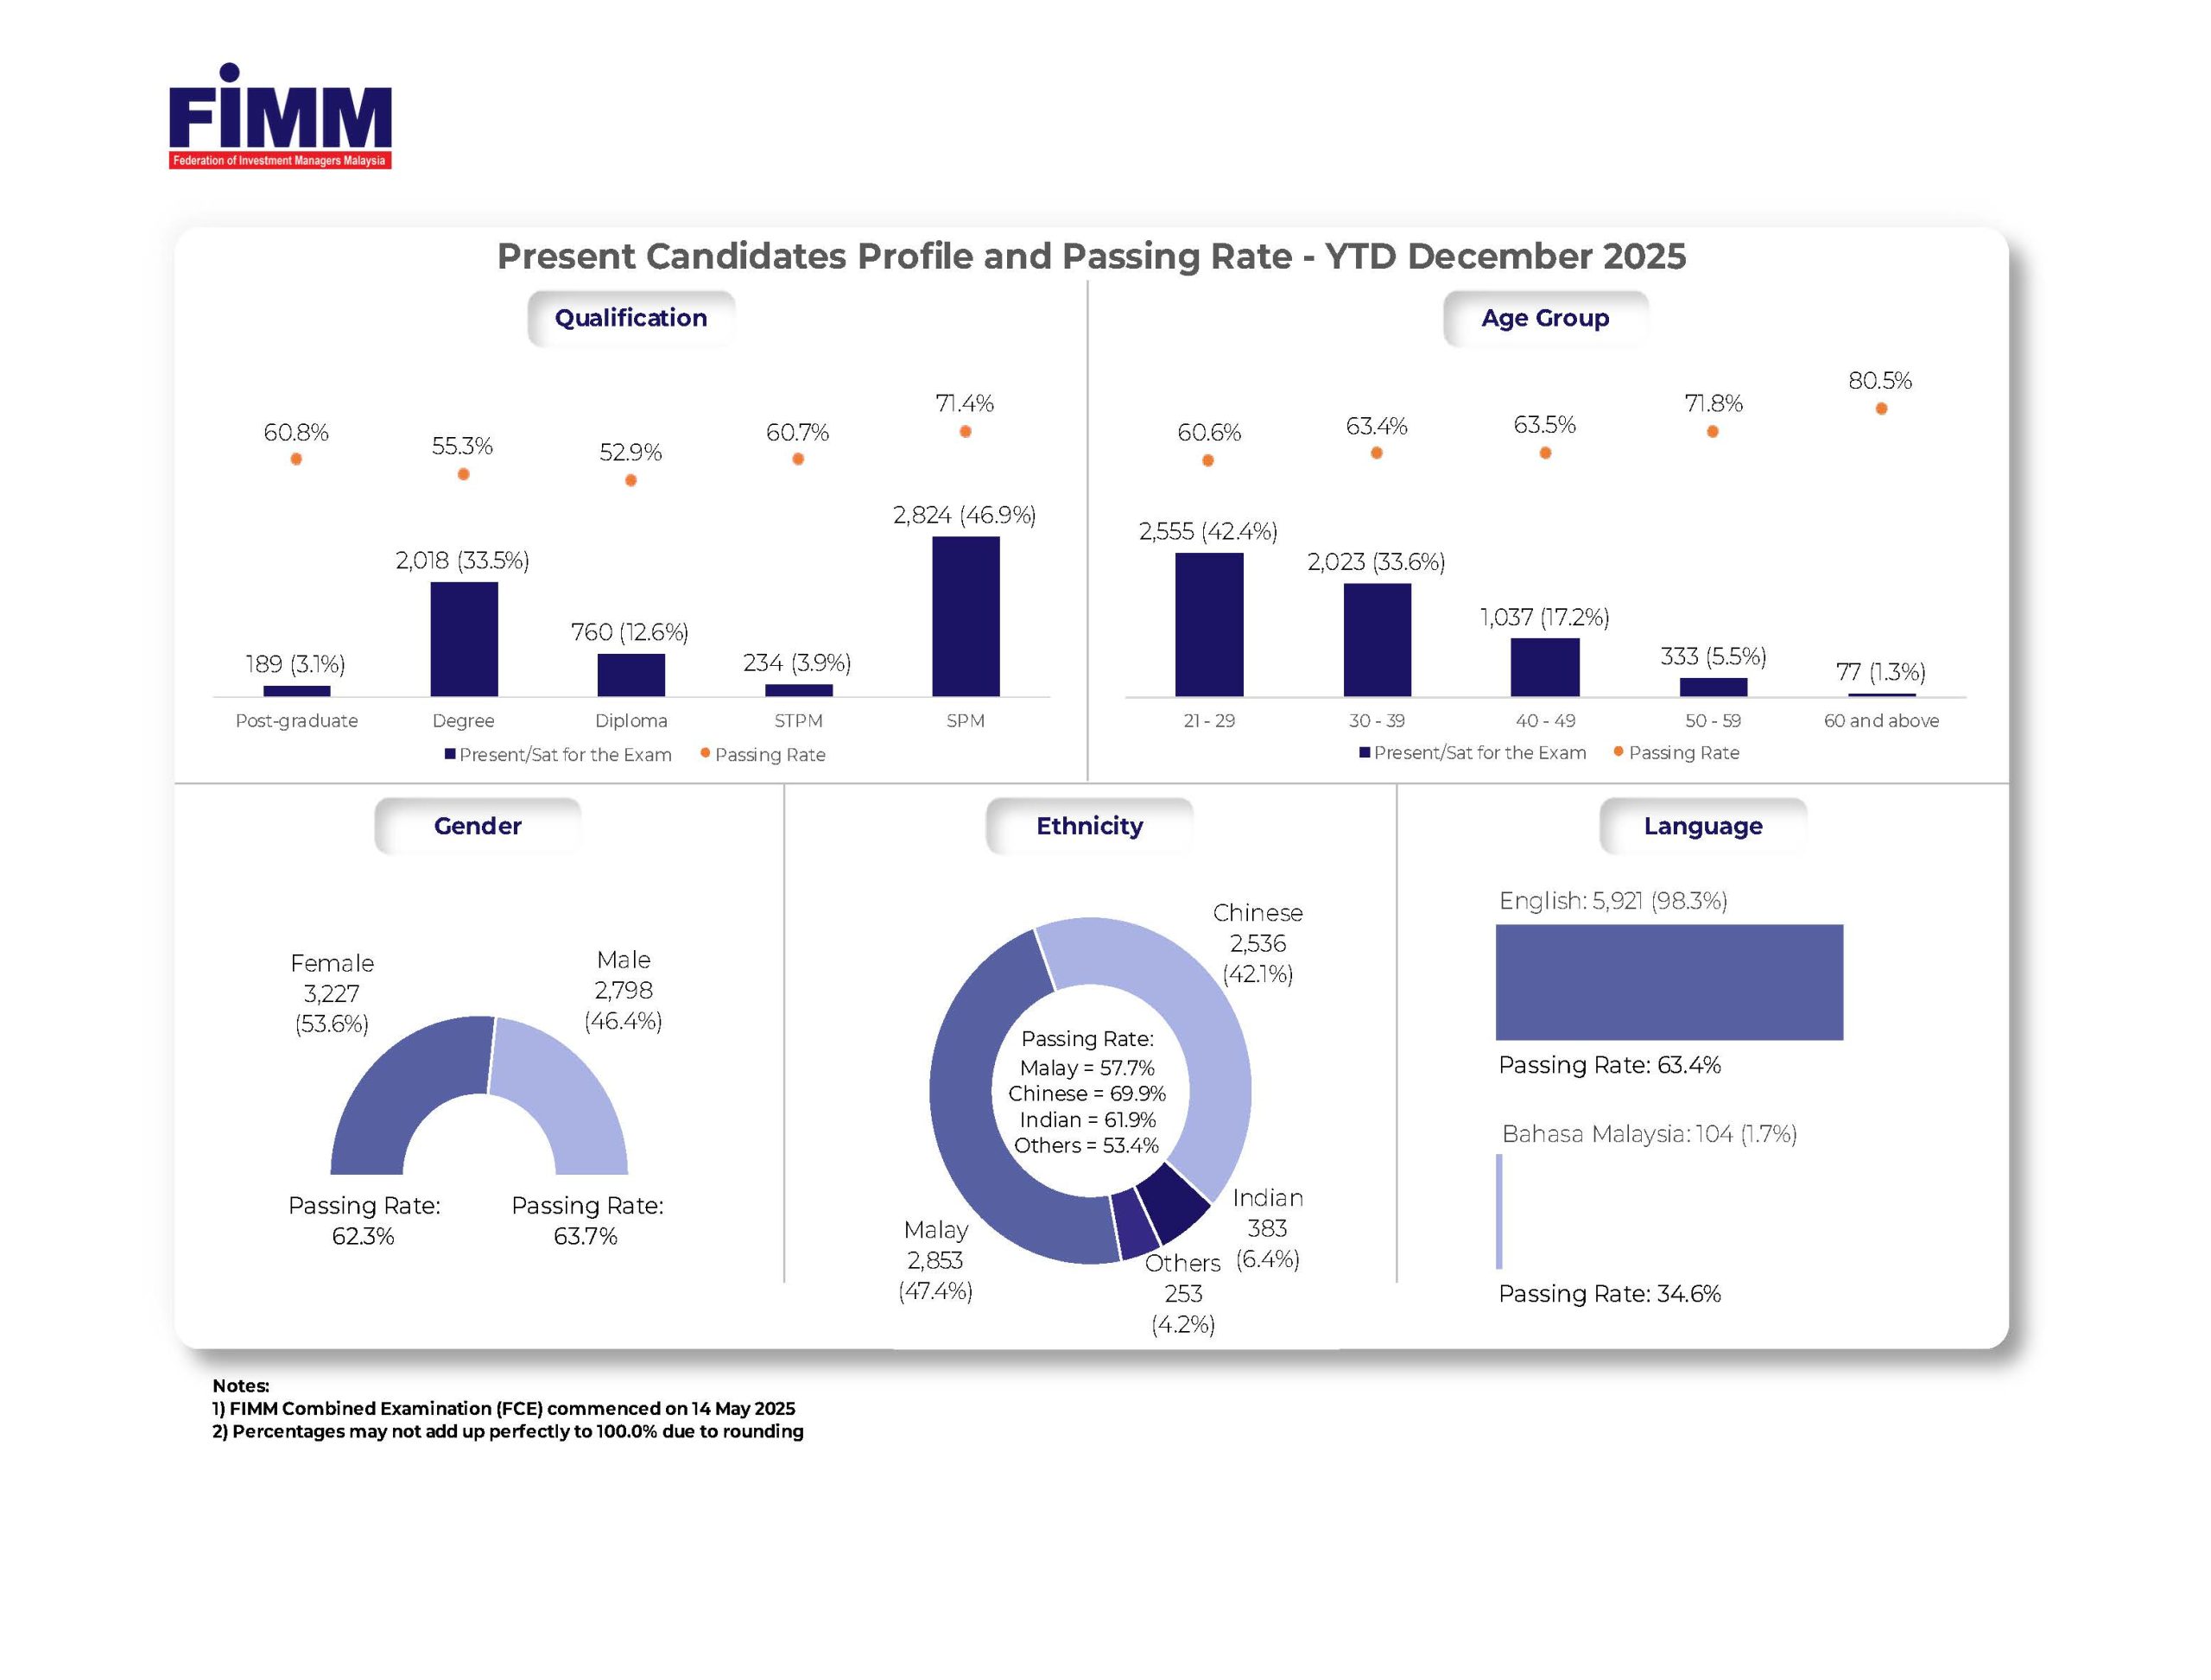
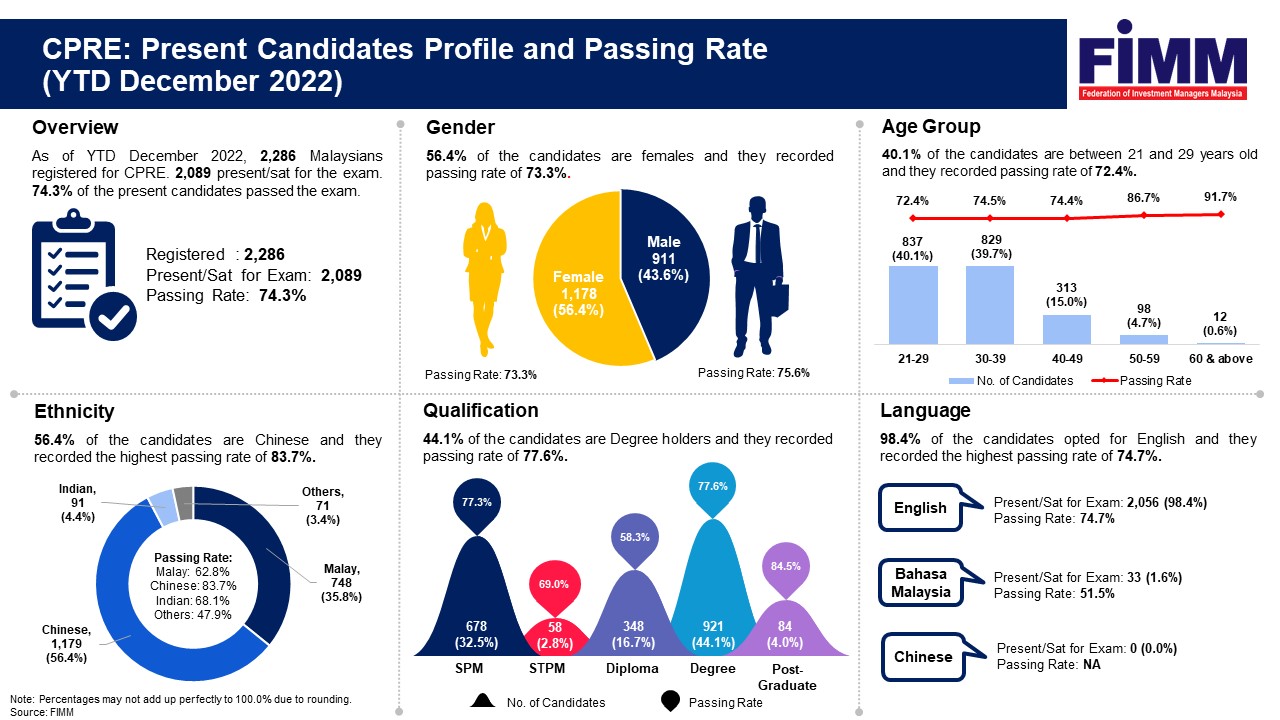
Present Candidate Profile and Passing Rate
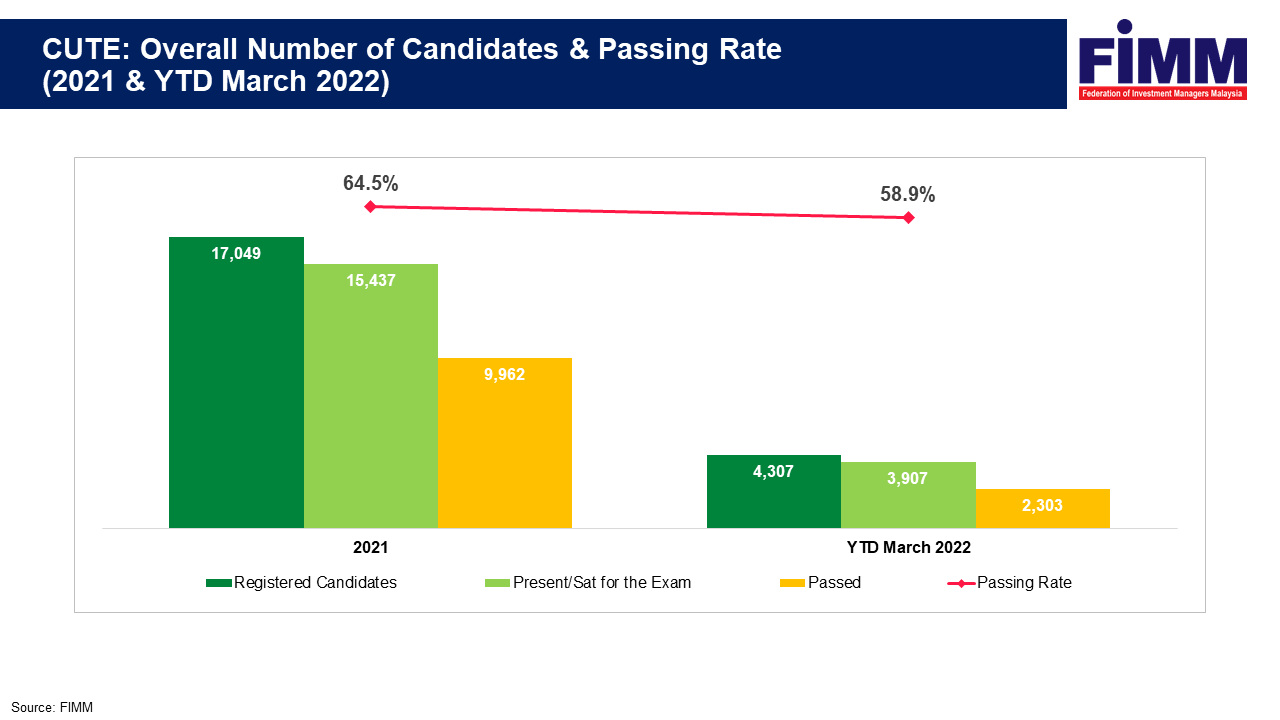
Q1
Overall Number of Candidates and Passing Rate
Present Candidate Profile and Passing Rate
Q1
Overall Number of Candidates and Passing Rate
Present Candidate Profile and Passing Rate
Q2

Overall Number of Candidates and Passing Rate

Present Candidate Profile and Passing Rate
Q3

Overall Number of Candidates and Passing Rate

Present Candidate Profile and Passing Rate
Q4
Overall Number of Candidates and Passing Rate

Present Candidate Profile and Passing Rate
Q1

Overall Number of Candidates and Passing Rate

Present Candidate Profile and Passing Rate
Q2
Overall Number of Candidates and Passing Rate

Present Candidate Profile and Passing Rate
Q3
Overall Number of Candidates and Passing Rate

Present Candidate Profile and Passing Rate
Q4
Overall Number of Candidates and Passing Rate

Present Candidate Profile and Passing Rate
Q1
Overall Number of Candidates and Passing Rate
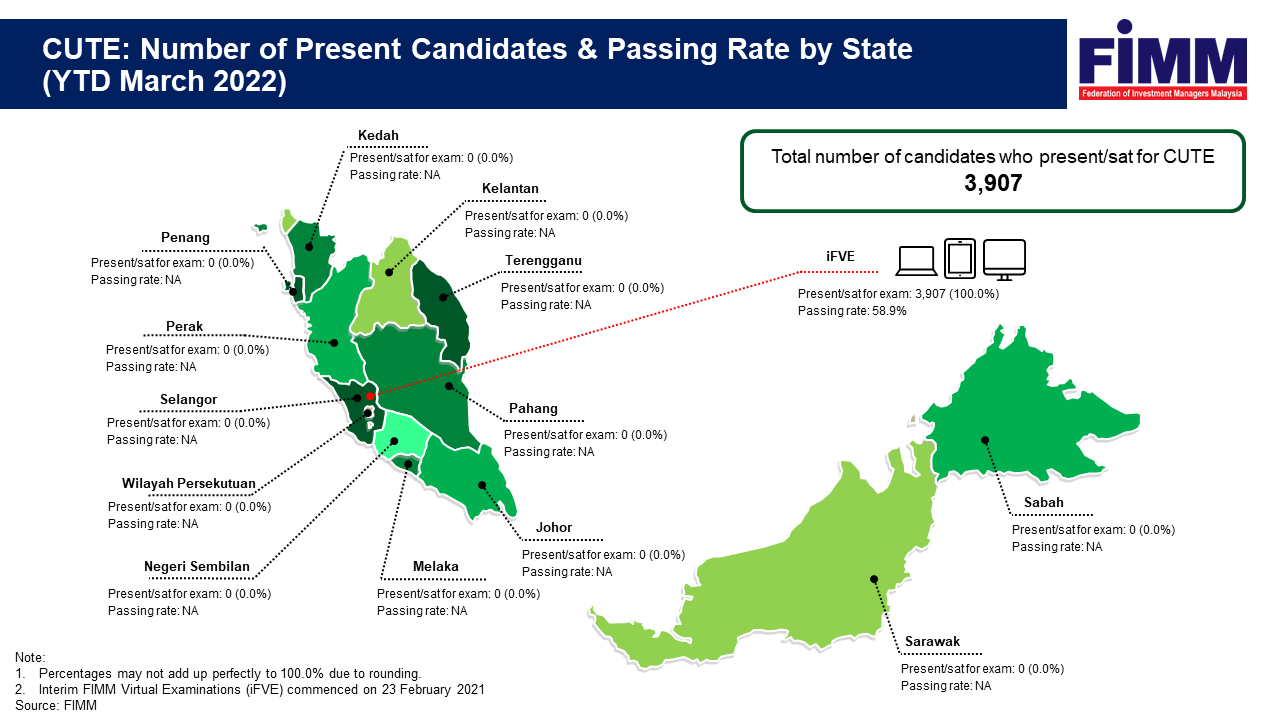
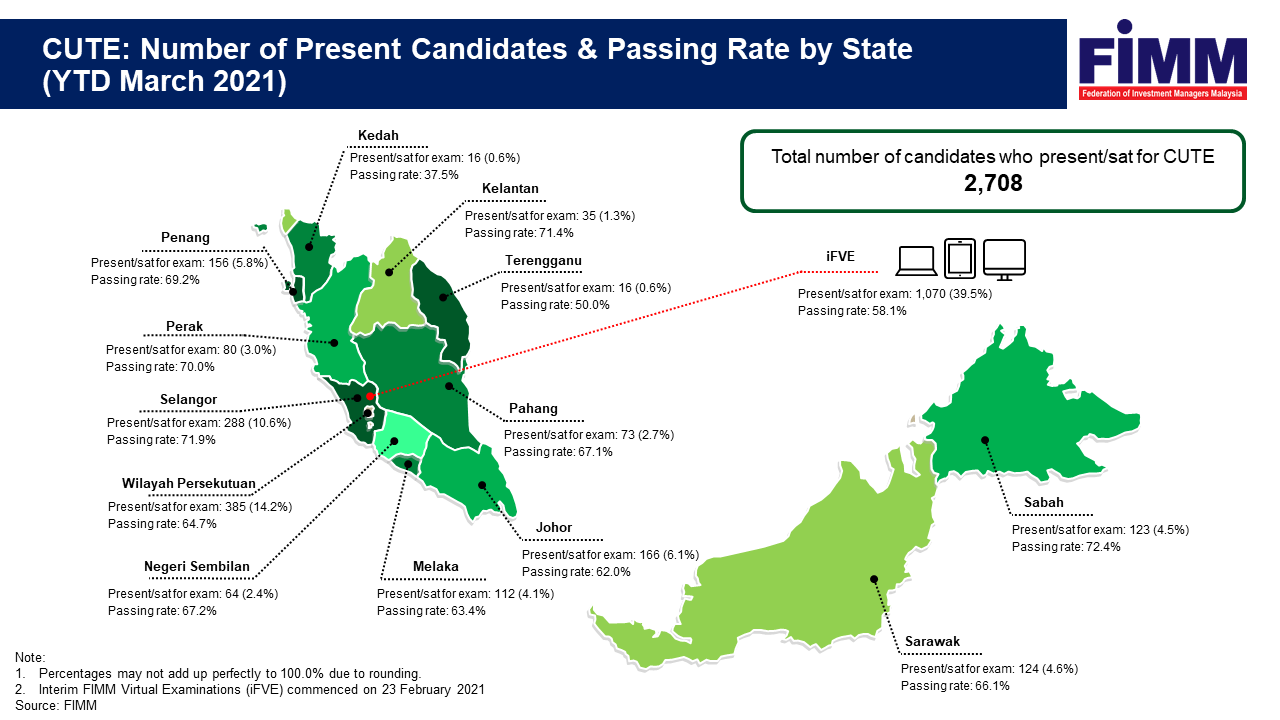
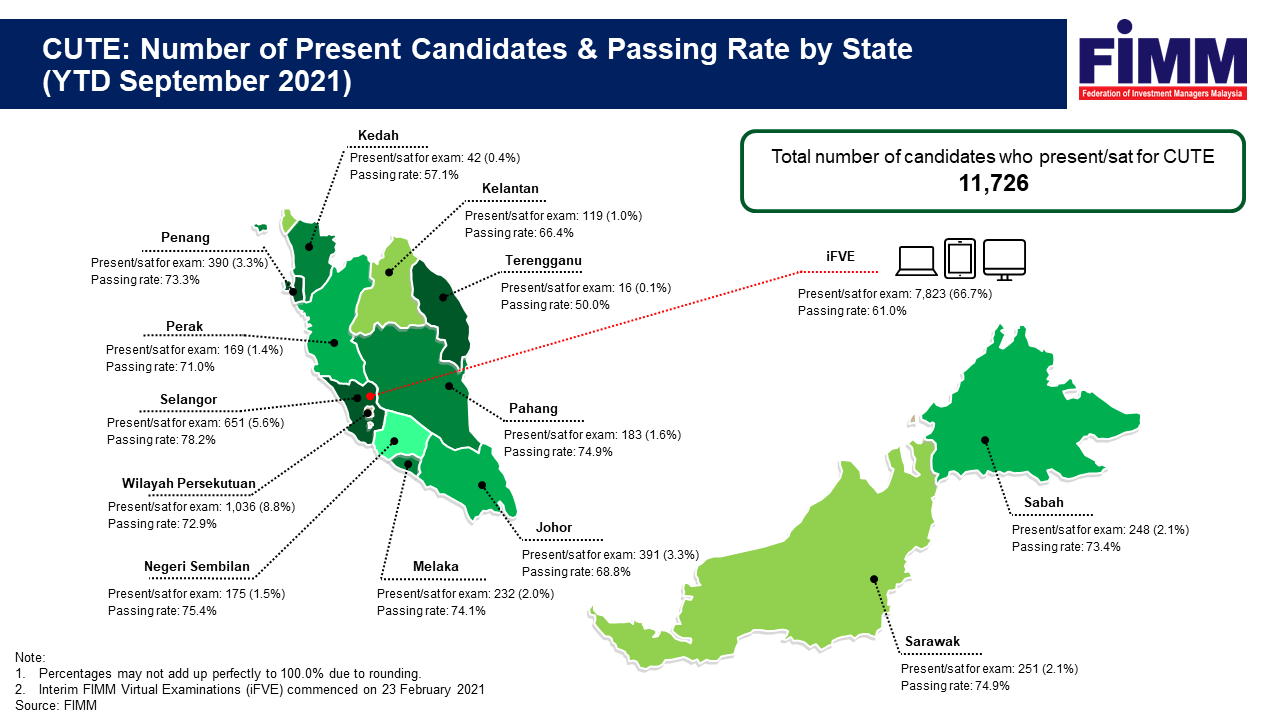
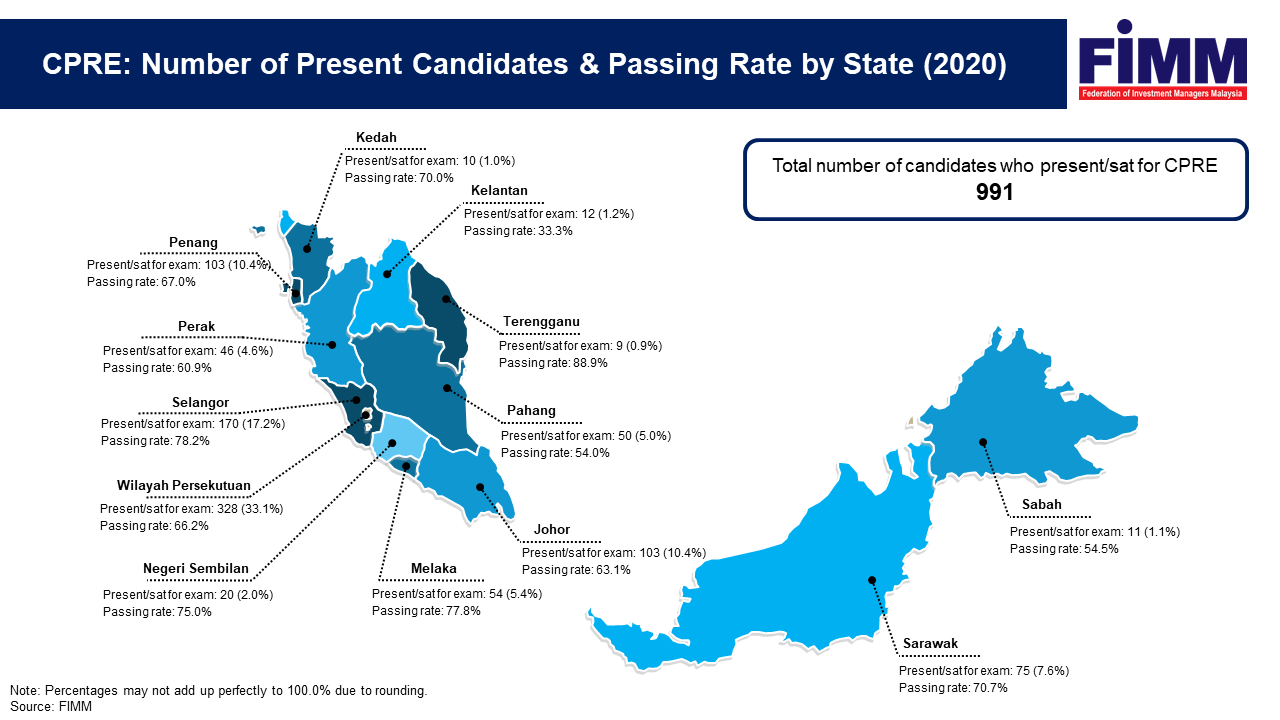
Number of Present Candidate and Passing Rate by State

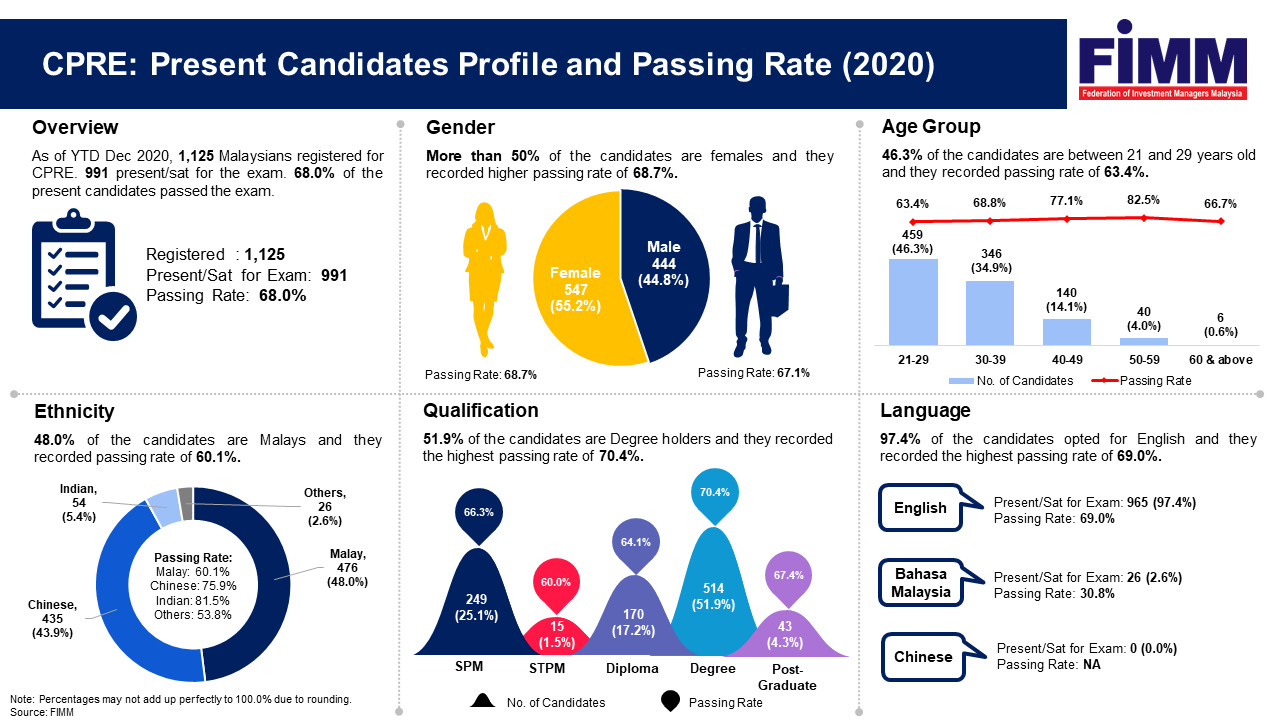
Present Candidate Profile and Passing Rate
Q2
Overall Number of Candidates and Passing Rate
Present Candidate Profile and Passing Rate
Q3
Overall Number of Candidates and Passing Rate
Number of Present Candidate and Passing Rate by State
Q4
Overall Number of Candidates and Passing Rate

Number of Present Candidate and Passing Rate by State
Q1
Overall Number of Candidates and Passing Rate
Number of Present Candidate and Passing Rate by State
Present Candidate Profile and Passing Rate
Q2
Overall Number of Candidates and Passing Rate

Number of Present Candidate and Passing Rate by State

Present Candidate Profile and Passing Rate
Q3
Overall Number of Candidates and Passing Rate
Number of Present Candidate and Passing Rate by State
Present Candidate Profile and Passing Rate
Q4
Overall Number of Candidates and Passing Rate

Number of Present Candidate and Passing Rate by State

Present Candidate Profile and Passing Rate
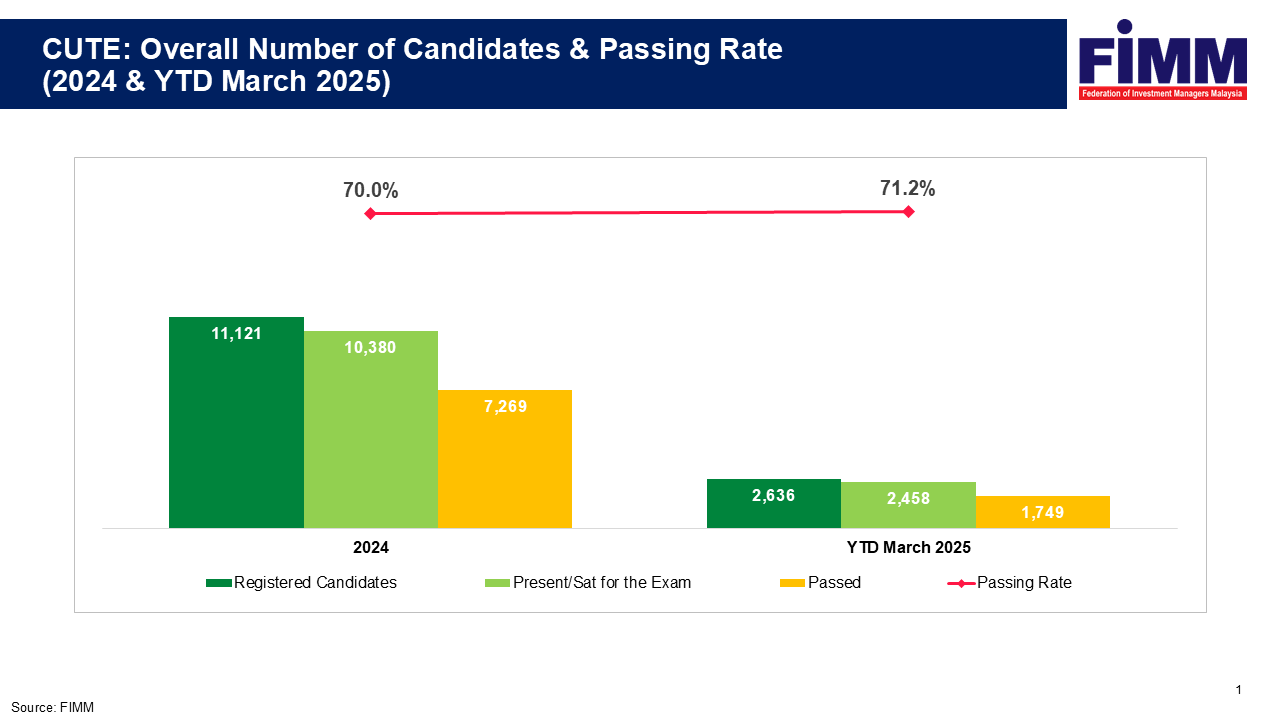
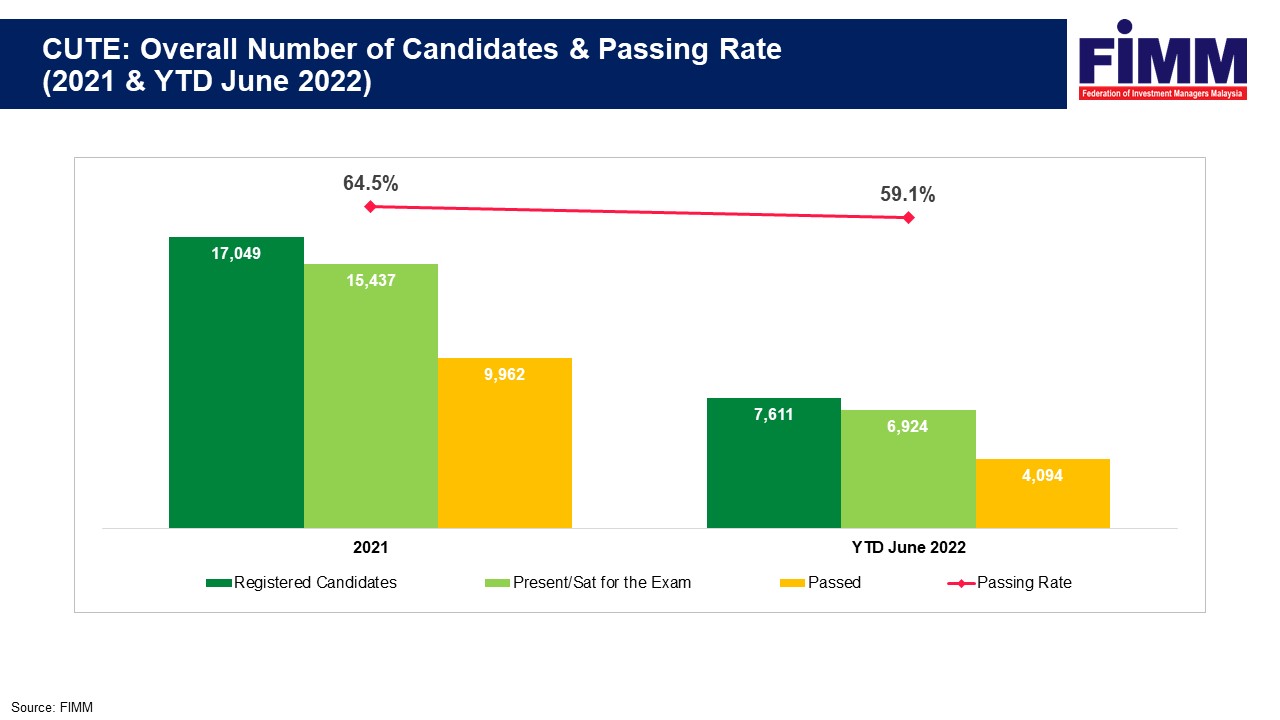
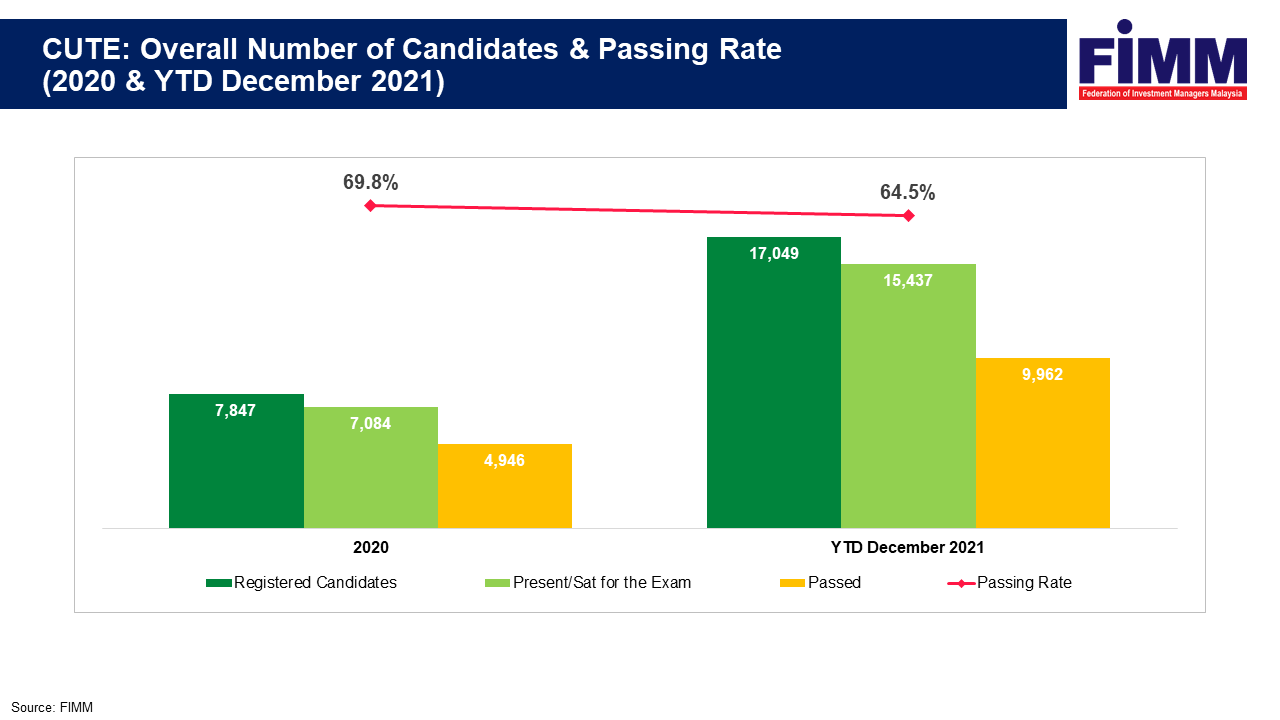
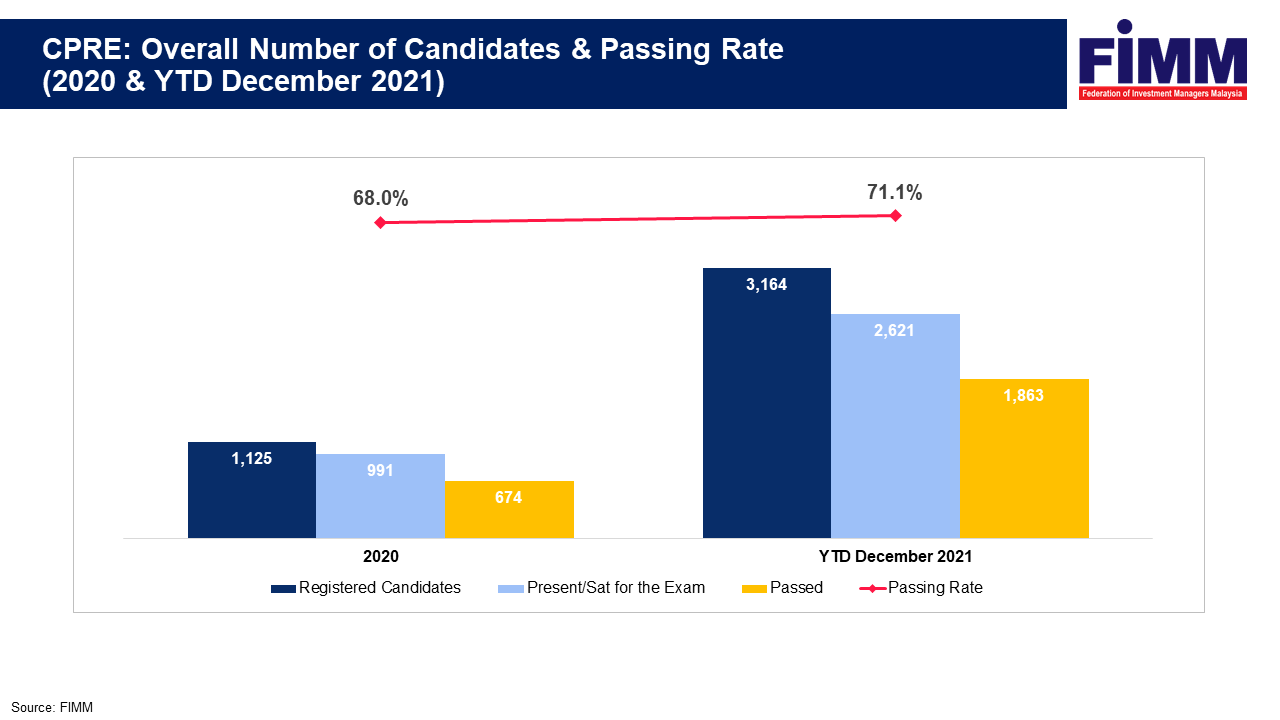
Overall Number of Candidates and Passing Rate
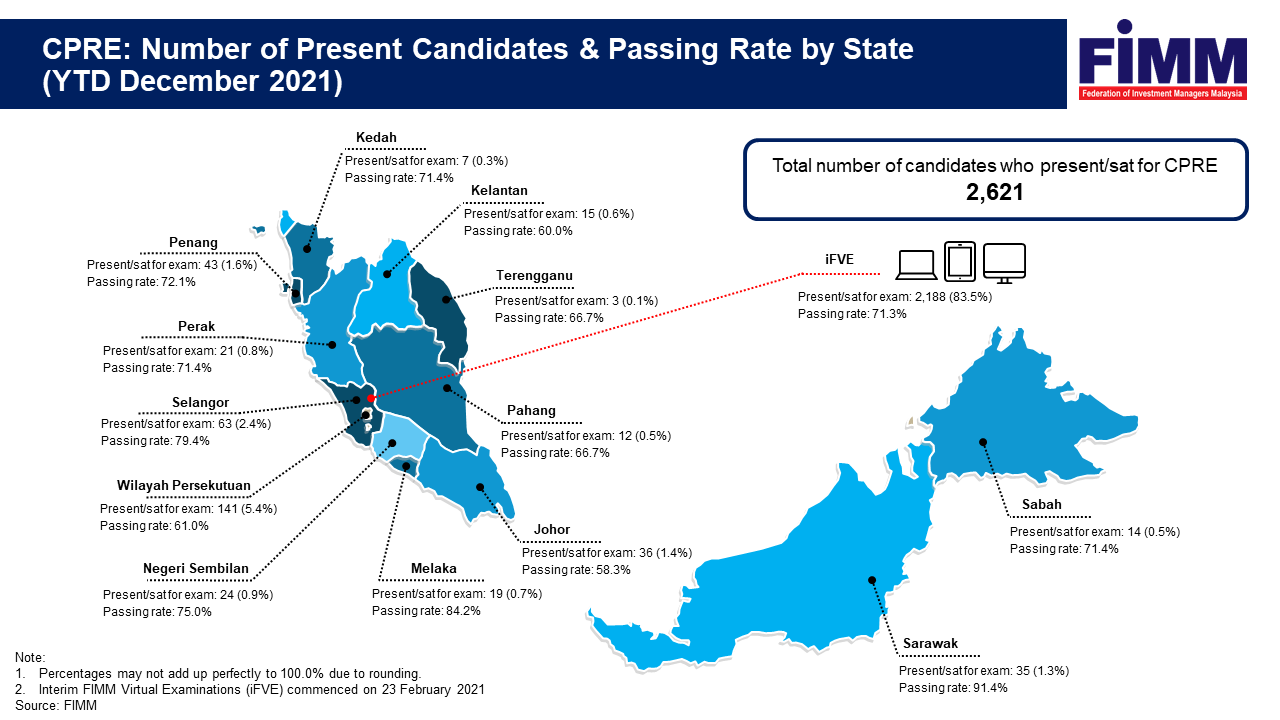
Number of Present Candidate and Passing Rate by State
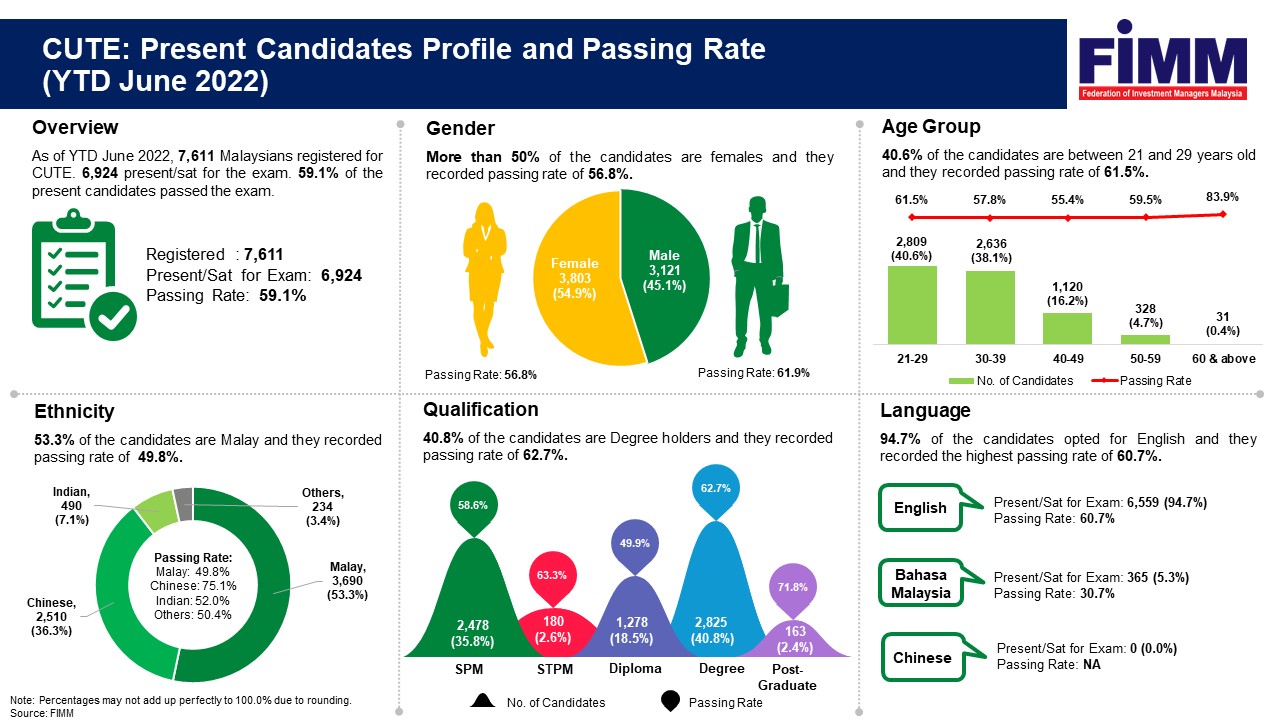
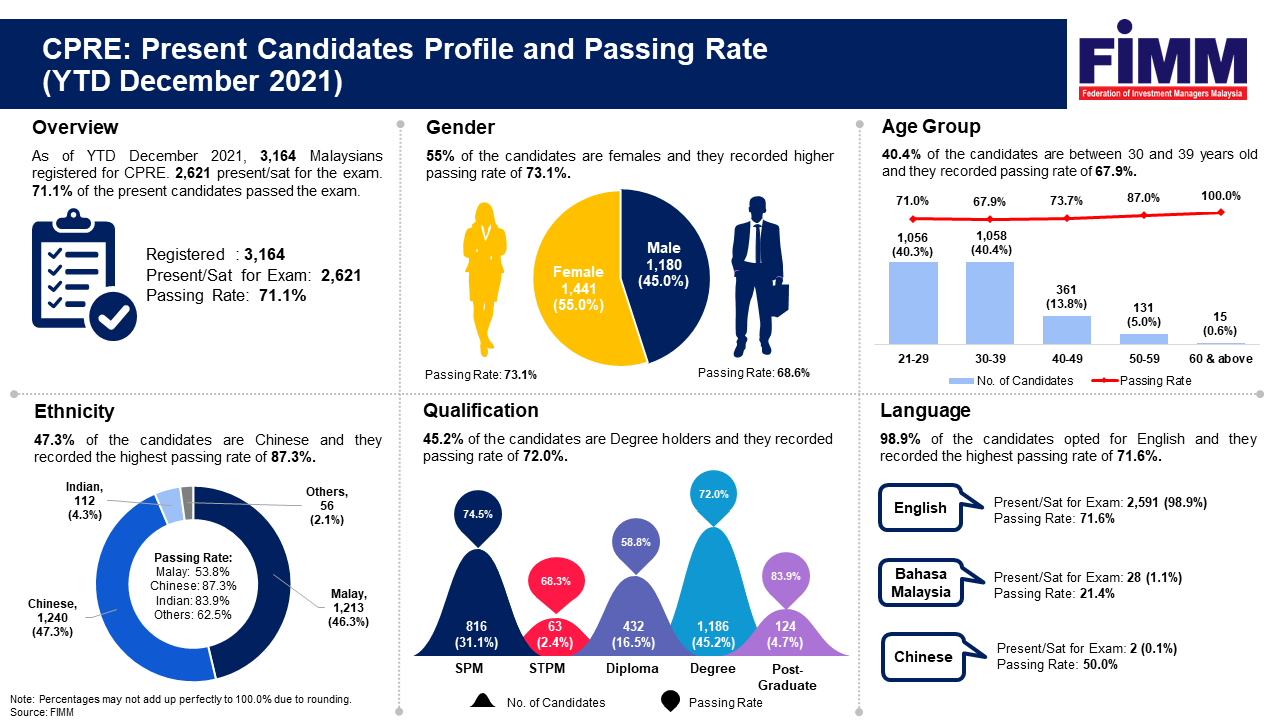
Present Candidate Profile and Passing Rate
Q1

Overall Number of Candidates and Passing Rate

Present Candidate Profile and Passing Rate
Q1
Overall Number of Candidates and Passing Rate

Present Candidate Profile and Passing Rate
Q2

Overall Number of Candidates and Passing Rate

Present Candidate Profile and Passing Rate
Q3
Overall Number of Candidates and Passing Rate

Present Candidate Profile and Passing Rate
Q4
Overall Number of Candidates and Passing Rate

Present Candidate Profile and Passing Rate
Q1
Overall Number of Candidates and Passing Rate
Present Candidate Profile and Passing Rate
Q2
Overall Number of Candidates and Passing Rate
Present Candidate Profile and Passing Rate
Q3
Overall Number of Candidates and Passing Rate

Present Candidate Profile and Passing Rate
Q4
Overall Number of Candidates and Passing Rate

Present Candidate Profile and Passing Rate
Q1
Overall Number of Candidates and Passing Rate

Number of Present Candidate and Passing Rate by State
Present Candidate Profile and Passing Rate
Q2
Overall Number of Candidates and Passing Rate

Present Candidate Profile and Passing Rate
Q3
Overall Number of Candidates and Passing Rate

Number of Present Candidate and Passing Rate by State
Q4
Overall Number of Candidates and Passing Rate
Number of Present Candidate and Passing Rate by State
Q1
Overall Number of Candidates and Passing Rate

Number of Present Candidate and Passing Rate by State

Present Candidate Profile and Passing Rate
Q2
Overall Number of Candidates and Passing Rate

Number of Present Candidate and Passing Rate by State
Present Candidate Profile and Passing Rate
Q3
Overall Number of Candidates and Passing Rate

Number of Present Candidate and Passing Rate by State

Present Candidate Profile and Passing Rate
Q4
Overall Number of Candidates and Passing Rate
Number of Present Candidate and Passing Rate by State
Present Candidate Profile and Passing Rate
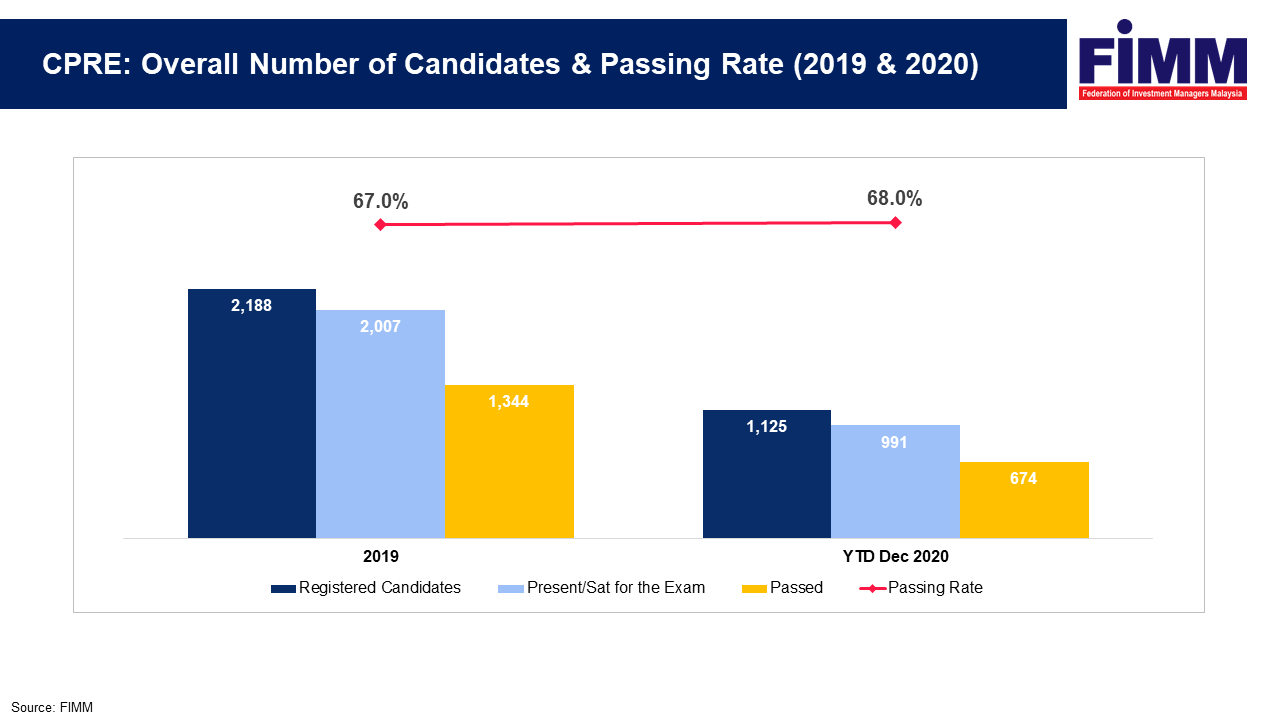
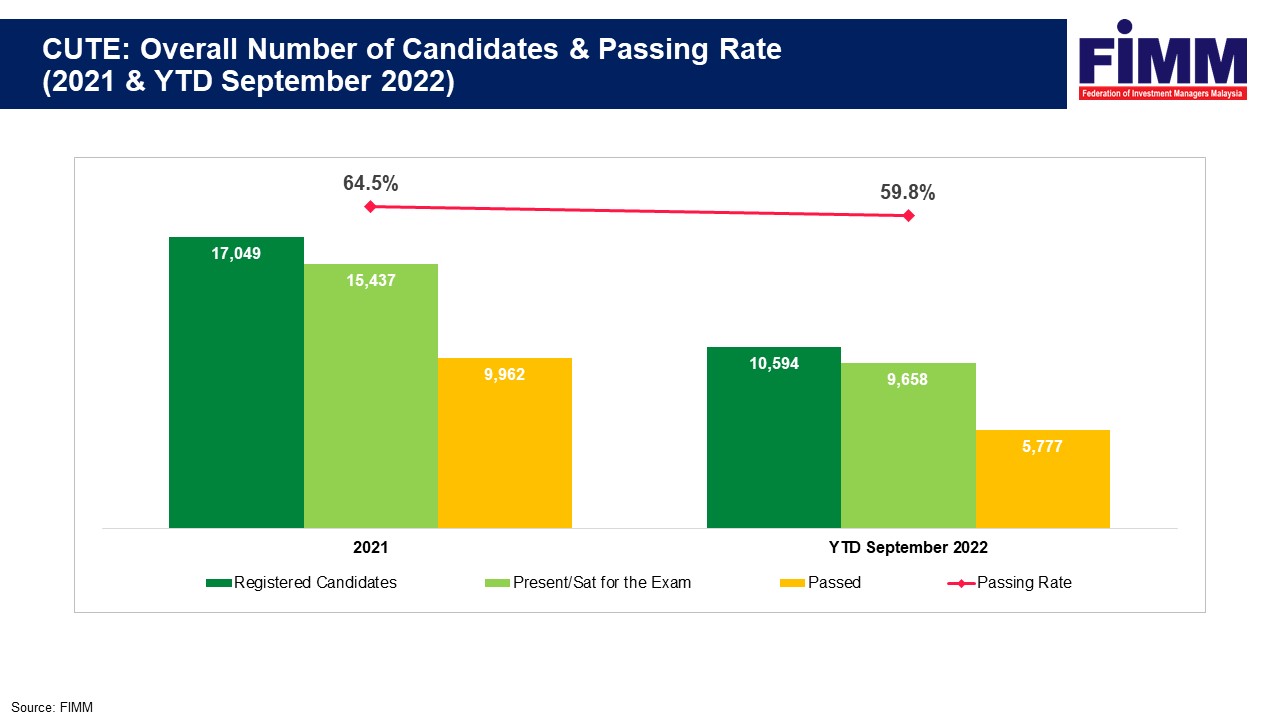
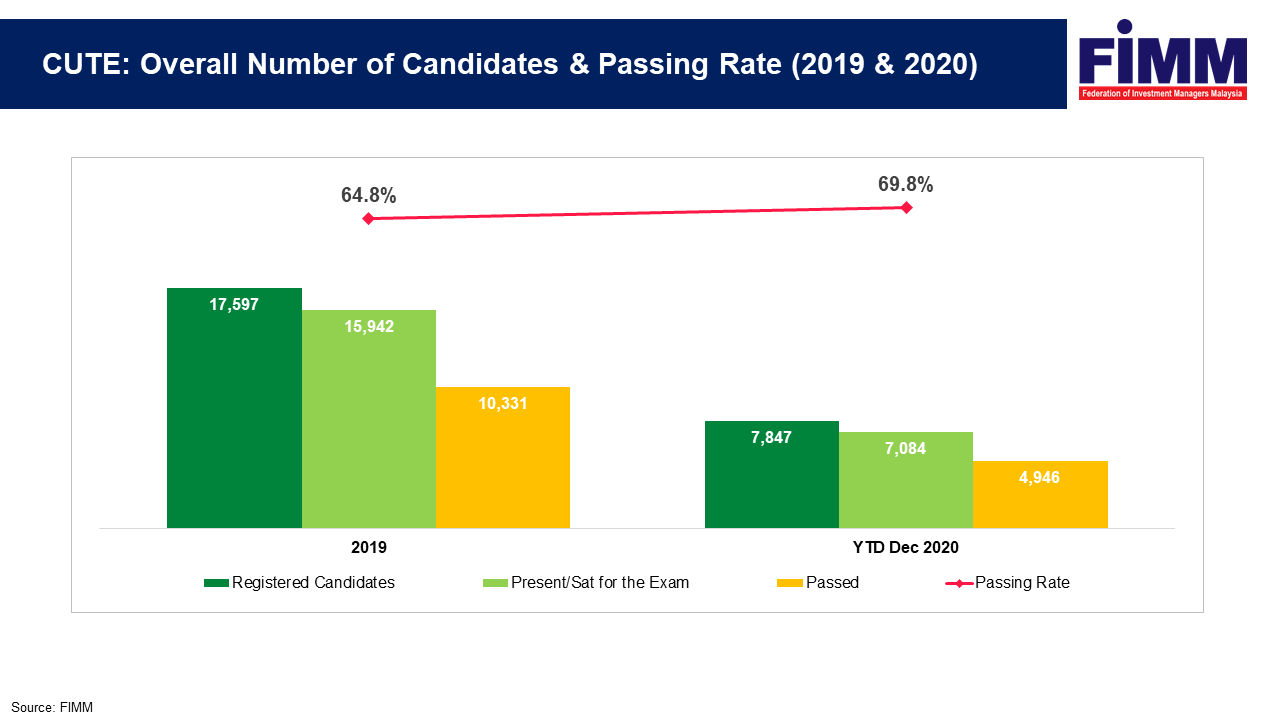
Overall Number of Candidates and Passing Rate
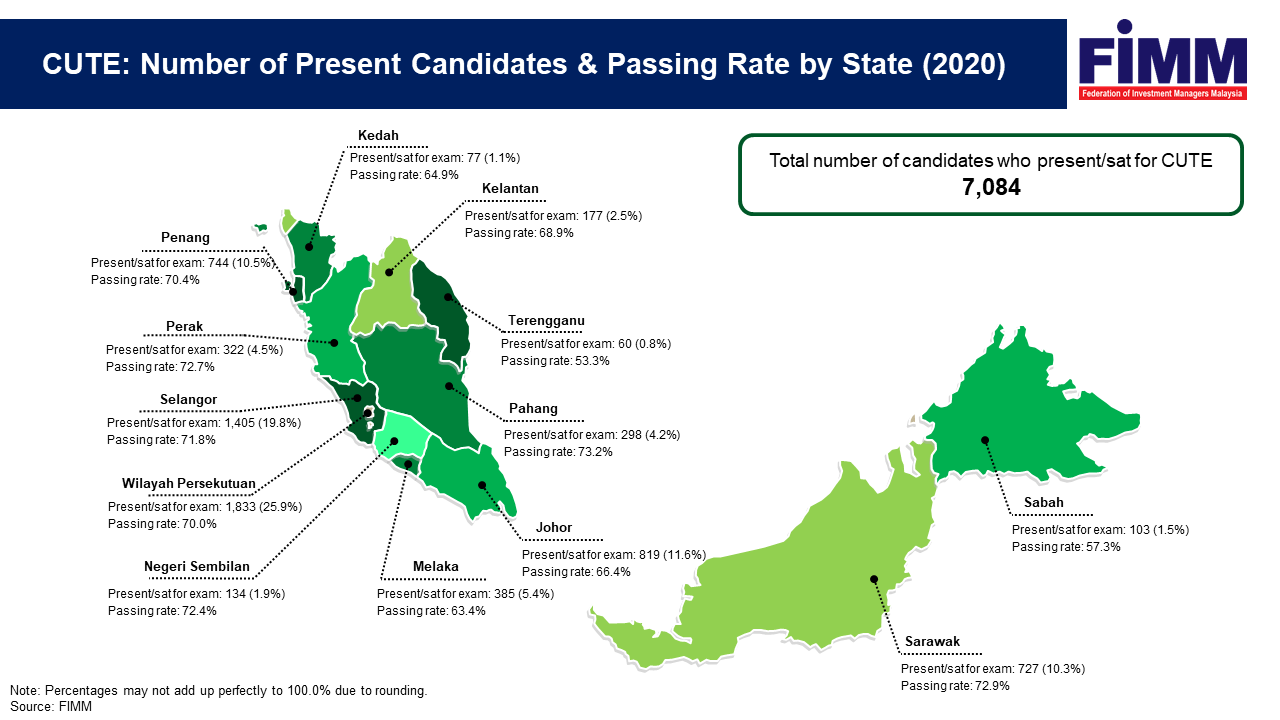
Number of Present Candidate and Passing Rate by State
Present Candidate Profile and Passing Rate